

Abstract
Background and issues
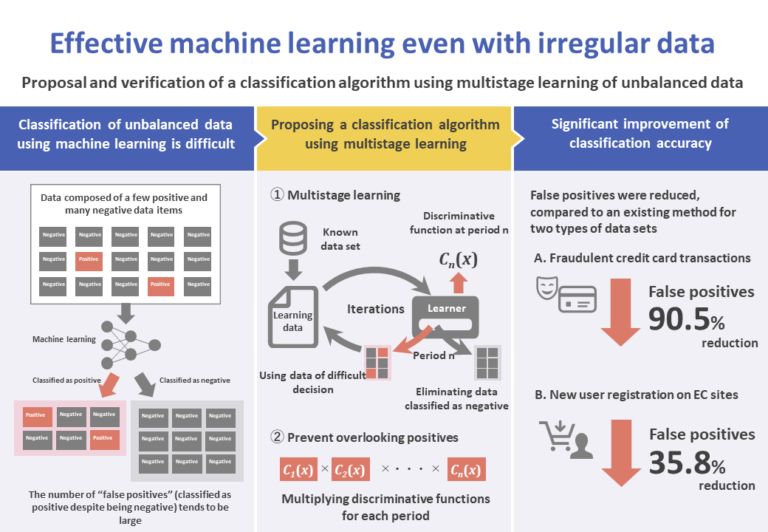
Classifying data into two classes, positive and negative, using machine learning, which is a type of artificial intelligence, has a wide field of application, such as medical diagnostic imaging and predicting the fraudulent use of credit cards.
Classification by machine learning requires a learning process, using a large amount of data already known to be positive or negative. However, in many applications, the target data are unbalanced, consisting of a small amount of positive data and a large amount of negative data. The use of unbalanced data results in accuracy deterioration.
The method of sampling (extracting) positive and negative learning data in a 1:1 proportion is called sampling learning. One method of sampling learning is called undersampling, in which samples are extracted from large amounts of negative data in order to obtain data comparable in number to a small set of positive data.
On the other hand, methods of improving classification accuracy by combining multiple weak learners are called ensemble learning methods. Specifically, bagging is a method that splits data and combines weak learners that learn on split data. It is characterized by the fact that the variations in predicted results are small, and learning can be carried out in parallel, since different data sets are used in different weak learners.
So far, methods using hybrid models that combine undersampling and bagging have been proposed as two-class classification algorithms for unbalanced data.
The present research has the objective of solving the problem of unbalanced data and improving classification accuracy. We propose a new algorithm that performs multistage learning iteratively on data considered difficult to classify, and combines such multiple resulting models to reduce the occurrence of false positives.
Evaluation method
To confirm the classification accuracy of the method proposed in the present research, we conduct experiments using two data sets, A and B.
Data set A consists of two-day records of credit card usage. This is used to classify a given usage record into fraudulent (positive) or normal (negative) transactions.
Data set B consists of records of electronic commerce (EC) site access logs from May to July of a certain year. Using this, we classify sessions from August of that year, indicating whether the new membership registration on the EC site took place (positive) or did not take place (negative).
When positive data are predicted to be positive, they are denominated true positive; when they are predicted to be negative, they are denominated false negative. When negative data are predicted to be positive, they are denominated false positive; when they are predicted to be negative, they are denominated true negative.
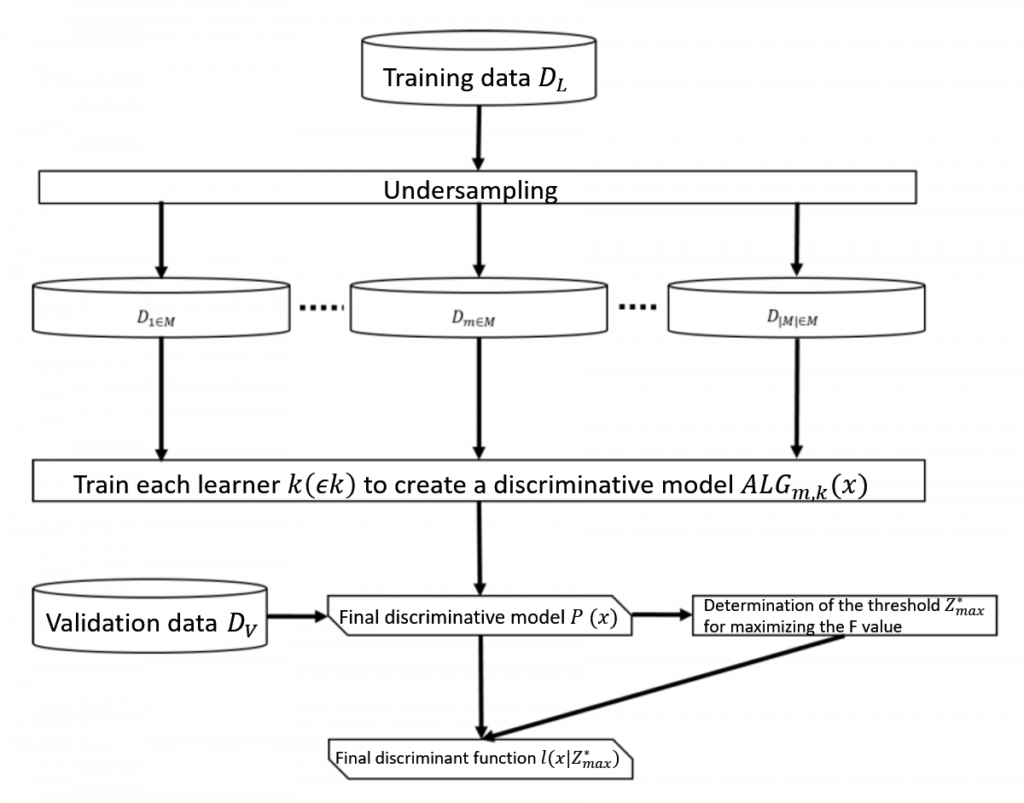
Definition of the baseline model
Consider a set D of known data x, classified into class 1 (positive) or class 0 (negative).
D is split into a learning data set DL and a validation data set DV.
Consider K to be the set of learners to be used, and M the family of data sets selected from DL by undersampling.
Given some data x, assigned to either class 1 or class 0, the probabilistic model that returns the probability p ( x) ∈ [0, 1] of being class 1 is defined as the discriminative model, and the function that classifies the output of the probabilistic model, using a threshold z ∈ [0, 1], is defined as the discriminative function.
In the baseline model, each learner k (∈ K) is used on each data set Dm ∈ M selected from DL to build the discriminative model ALGm,k(x), which outputs the average, is the final discriminative model.
When this discriminative model P(x) is used on DV to perform classification with a threshold z ∈ [0, 1], the discriminative function that uses the value z*max that maximizes the F-value (the harmonic mean between precision and recall) as the threshold is expressed as I (x | z*max) (Figure 1; left).
Proposed method
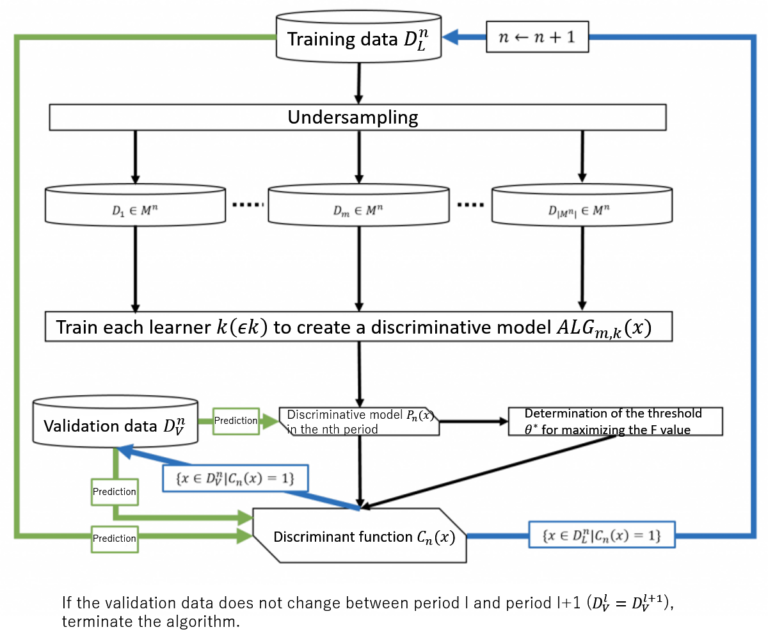
In the proposed method, the problem of unbalanced learning data is solved and the occurrence of false positives in the evaluation data is reduced by gradually eliminating data classified as negative during the learning process. A discriminative model and a discriminative function are created in every period of learning. Data which were considered difficult to classify in the previous period are used to build the discriminative model of the next period.
Consider DnL and DnV to be respectively the learning and validation data sets used in the nth period. In the first period, we have D1L = DL and D1V = DV. K is the set of learners used, and Mn is the family of data sets selected by undersampling in period n (= 1, 2, …) from DnL.
In the nth period, learner k (∈ K) is used to learn from data set Dm ∈ Mn selected from DnL, resulting in the discriminative model ALGm,k(x). Pn(x), which outputs the average, is the discriminative model for period n.
The precision and recall for the classification of DnV using threshold θ ∈ [0, 1] and the discriminative model Pn(x) are expressed as Pre(x|θ) and Rec(x|θ), respectively. Here, we obtain θ* = argmax0≤θ≤1(Pre(x|θ) | Rec(x|θ) = 1). The discriminative function that uses the obtained value as a threshold for period n is denoted Cn(x).
Next, the learning and validation data sets for period n + 1 are updated as Dn+1L = {x ∈ DnL | Cn(x) = 1} and Dn+1v = {x ∈ DnV | Cn(x) = 1}, respectively, and the process is repeated for the following period in the same manner. In other words, the data classified as negative in the current period are excluded from the data set and are used as the data set for the next period.
If the validation data do not change from period l to l + 1 (Dlv = Dl+1v), a discriminative function I (x | z*max) is created using as a threshold the value zmax that maximizes the F-value in the classification of data DlV using Pl(x) with a threshold zmax ∈ [0, 1], thus completing the algorithm. The final discriminative function is I (x | z*max) ∏ln=1Cn(x) (Figure 1; right).
The proposed method avoids predicting as positive those cases that are clearly negative by using ∏ln=1Cn(x), formed by the multiplication of discriminative functions Cn(x), which perform classification in a manner that avoids overlooking positive cases generated in each period. By doing so, the number of false positives can be reduced.
Results and proposal
To evaluate the effectiveness of the proposed method, we applied a baseline model (existing method) and the proposed method on data sets A and B, and compared the results.
When applied to data set A, the proposed method resulted in higher accuracy in all evaluation parameters compared to the existing method. A significant reduction in false positives was achieved, compared to the 9.5% value obtained by the existing method (Table 1; left).
When applied to data set B, the proposed method resulted in higher accuracy in all evaluation parameters compared to the existing method. A significant reduction in false positives was achieved, compared to the 64.2% value obtained by the existing method. On the other hand, false negatives increased by 3.43% (Table 1; right).
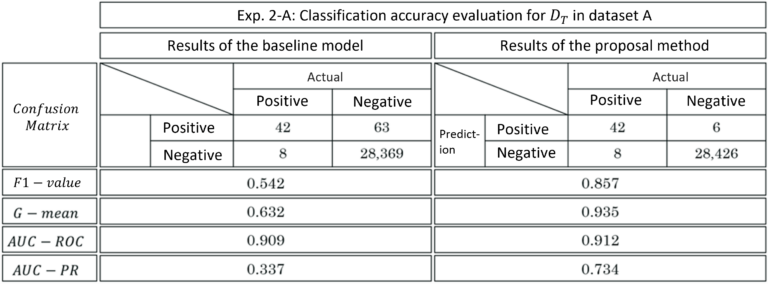
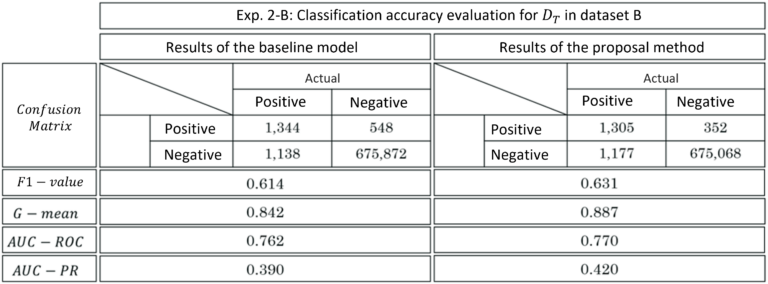
For both data sets, the proposed method outperformed the existing method in all evaluation parameters. The improvement in classification accuracy results mostly from the expected reduction in the number of false positives.
F-value and G-mean (geometric mean between precision and specificity) were used to evaluate the discriminative function, and Area Under the Curve-Receiver Operating Characteristic (AUC-ROC) and Area Under the Curve-Precision Recall (AUC-PR) were used to evaluate the discriminative model. As a result, the proposed method outperformed the existing method in all evaluation parameters.
Thus, the effectiveness of the proposed method has been demonstrated.