

Abstract
Background and issues
Smart mobile devices (hereinafter referred to as “smartphones”) are rapidly spreading throughout the world. In Japan, smartphone possession rose from less than 10% of households in 2010 to nearly 80% in 2018 (2018 Communications Usage Trend Survey by the Ministry of Internal Affairs and Communications). As a result, the competition for users of mobile applications is intensifying.
A strategic method used by application developers to encourage users to download and start using applications is the “recommendation system”. This is a system that selects and displays content supposed to be useful to a particular user.
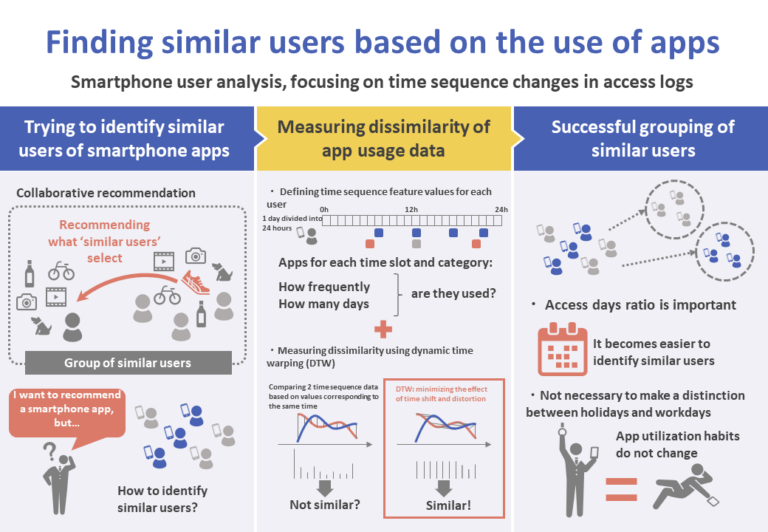
“Collaborative recommendation” is a method that recommends to a particular user what “other similar users” have selected. In order to apply this method to applications, it is necessary to classify in the same group those users who use the same kind of applications at the same time of day (users with similar tastes in and patterns of use of applications).
In view of that, the objective of the present research is to classify users into groups by using dissimilarities between feature values. A day is divided into 24 time slots, and feature values are defined based on the access frequency per application category by time slot and the access days ratio.
There are a number of methods of measuring the dissimilarity between time sequence data, such as data obtained in different time slots. In the present research, we use dynamic time warping (DTW). DTW is a transformation process that measures the dissimilarity between two items of time sequence data, minimizing the effects of time shifts and distortions by shifting the time axis.
Smartphone applications are used relatively more often in the morning and at lunchtime. Usage intensifies from the evening into the night, decreasing from late at night until dawn. Since this usage trend varies depending on individual life patterns, it is expected that DTW can be used as a similarity index between users’ time sequence feature values.
Data analysis
Data used
In the present research, we use access logs and application information data from April 1st to June 30th, 2019, provided by Fuller, Inc., a company that offers application analysis support, as our partner in joint research as part of an academic–industrial partnership project.
Access logs are records for each device indicating which applications are accessed when, and with which application ID, and consist of the device’s ID, the dates and times when applications were accessed, and application IDs. A device ID is a random number assigned to uniquely identify a device. The application ID permits determining the category to which it belongs.
Here, as a preparation for generating feature values associated with weekdays or holidays, time slots, and categories, access logs and application information data are combined. A “holiday” label is assigned to the access log if the access day is a Saturday or Sunday, or “weekday” otherwise. A time slot label t from zero to 23 o’clock is then assigned, according to the access time.
The set D of devices subject to analysis comprises the top 20%, in terms of the total number of access logs and total number of time slots for each day with access log, and includes only those devices with at least one access log per day during the target period. Outliers in the distribution of total access logs are eliminated.
For a given application a, access days are defined as those on which at least one access log was made by a device belonging to the target set. The set A of analysis target applications comprises those with a number of access days that exceeds 80% of the target period, after eliminating outliers related to the total number of access logs.
The set of categories to which analysis target applications belong is denominated C∗. For each category, if the devices for which the ratio of the number of access days to the number of days in the target period is 10% or lower correspond to at least 50% of the set of devices that accessed an application of category c at least once, the set of such categories is defined as Cˆ. The set of target categories C for analysis is obtained by eliminating Cˆ from C∗. There are 25 categories in the set of analysis target categories.
Analysis method
For each time slot on weekdays and holidays, and for each analysis target category, we calculated access frequencies and ratios of numbers of days with access logs. For device d we then obtained the time sequence feature value fwd related to the access frequency on weekday time slots, and the time sequence feature value pwd related to the access days ratio on weekday time slots. Time sequence feature values for holidays fsd and psd are defined in the same manner.
Using DTW, we obtain a sequence of time slot pairs Q = (q1, q2, …, qK) of data from two time sequences. The conditions that sequence Q must fulfill are: (1) ordering in time and continuity; (2) limit δ on the maximum time difference within time slot pairs, and; (3) existence or not of a sequence cycle (and the starting time slot, if it exists).
Based on the dissimilarity between the analysis target devices, which is based on a dissimilarity measure, we conduct clustering on the devices using the non-hierarchical clustering method k-medoids.
Evaluation and tests
We verified the entire set of feature values for the analysis target devices. As a whole, we notice from the average access frequency for each category that access frequencies tend to be low in time slots from 1am to 6am, for both weekdays and holidays.
There is no major difference between weekdays and holidays, especially in terms of access to categories. However, a few categories show a slight forward or backward shift in access time slots, which suggests that DTW must be effective.
In general, we notice from average access days ratios for each category that this ratio tends to be low late at night. This tendency is more evident on holidays than on weekdays.
In order to compare the effects of dissimilarities under different DTW conditions, we obtained average values for each time sequence feature value for devices subject to analysis, as well as time sequence feature values for the three most similar and the three most dissimilar devices, using different dissimilarity settings. Specific settings related to DTW dissimilarity conditions are shown in Table 1 (listed as DTW dissimilarities 1, 2, and 3).
| Dissimilarity | (1) Time ordering and continuity | (2) Maximum time difference in time slot pairδ | (3) Existence of cycle in sequence |
| 1 | Yes | 0 | No |
| 2 | Yes | 3 | No |
| 3 | Yes | 3 | Yes, time slot when cycle begins is 1 |
As a result, we found that dissimilarity 3 best catches the differences in trend due to time slot changes. As a consequence, we can say that compared to the other dissimilarity measures, dissimilarity measure 3 is the most appropriate for time sequence feature values for the analysis target devices.
We then prepared graphs showing inter-device similarity relations based on time sequence feature values, using dissimilarity measure 3. The graphs, in terms of access days ratios, showed that the largest cluster tended to concentrate in the center of the cluster. In graphs based on access frequencies, the largest cluster did not concentrate in the center of the cluster.
Based on this, we conclude that compared to the access frequency, the access days ratio can be better divided into clusters as the time sequence feature values of the analysis target devices. Hereinafter we will use only the access days ratio as time sequence feature values for the analysis target devices.
From the results of clustering obtained by the k-medoids method, we examined application usage characteristics and usage patterns in each group, based on representative points of clusters and average cluster feature values.
Only a minority of devices show considerable variations in the ways in which applications are accessed on weekdays and holidays, shifting to categories with different characteristics. It became clear that in most cases, the habitual use of smartphone applications does not change from weekdays to holidays.
Results and proposal
In the present research, we first extracted information on devices, applications and categories as analysis targets from Android smartphone users’ access logs and application data. For each time slot, we defined the access frequency and the access days ratio by category as time sequence feature values for the analysis target devices.
Then, in order to properly handle distortions and deviations in the distribution of start times arising from individual life patterns, the dissimilarity between time sequence feature values was defined using DTW. We learned that a dissimilarity measure that includes a cyclic condition is appropriate for the proposed analysis.
The resulting graphs that visualize the similarity between devices based on the dissimilarity measures show that the access days ratio enables easier clustering than access frequencies.
Using dissimilarities between the analysis target devices on weekdays and holidays expressed as time sequence feature values based on access days ratios, we conducted clustering on the analysis target devices using a shortest path measure and k-medoids. We found that in most cases, smartphone applications are used according to users’ habits, regardless of it being a weekday or holiday.