
Abstract
Background and issues
Anomaly detection (the operation of eliminating manufactured industrial products that are considered to be abnormal because they differ from the expected quality) is an important process at manufacturing sites of industrial products. On the other hand, the demand for automation of this operation has grown in recent years due to costs and differences in skills, as well as the issue of manpower shortage.
The present research is a joint project with Matsuda Denki Kogyosho Co., Ltd. (referred to as M), an automotive parts manufacturer. The area of research is restricted to product inspection, and only image data are considered.
The most commonly used method of anomaly detection is called deep anomaly detection (DAD), and is based on deep neural networks. However, it requires the preparation of a large quantity of data containing normal and abnormal labels for learning. The data-gathering process becomes difficult because in general, abnormalities do not occur frequently.
A popular approach to address this problem is data augmentation (DA) in image recognition tasks. DA is a technique to increase the volume of data by performing horizontal reversal of images, displacement, etc.
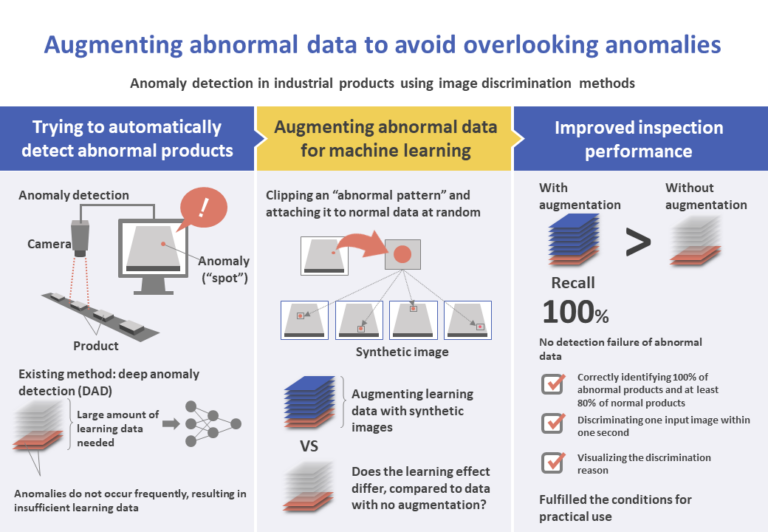
In the present research, in order to create a high-performance discriminative model for anomaly detection, we concentrate on overcoming the data shortage problem for supervised DAD and perform image data augmentation based on synthetic images to complement abnormal data. We then test the effectiveness by comparing the accuracies of a model learned by using real abnormal images and a model learned by using synthetic images.
Image data of car parts gathered at M’s manufacturing site are used as the data set. The three following conditions must be fulfilled, as agreed in interviews with M: to correctly discriminate all abnormal parts and at least 80% of normal parts; to discriminate an input image within one second; and to exhibit a visualization that makes it possible for the worker to confirm the reason for the discrimination.
Proposed method
The abnormal synthetic image is generated by attaching an image corresponding to the abnormal region of the abnormal image (abnormal pattern) to a normal image. In that process, the area where the abnormal pattern is attached and the shape and color of the abnormal pattern are randomized.
However, if an abnormal pattern is attached to an arbitrary place within the image, there is a possibility that the abnormality will remain in the background, and the object itself remains normal. Therefore, the place where an abnormal pattern is attached is restricted to regions within the image where abnormalities can occur. For this reason, as a prior data formation process, we distinguish within each image the areas corresponding to object and background.
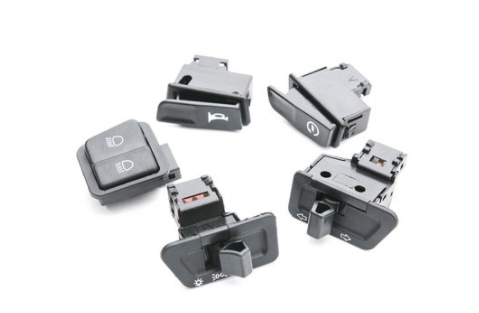
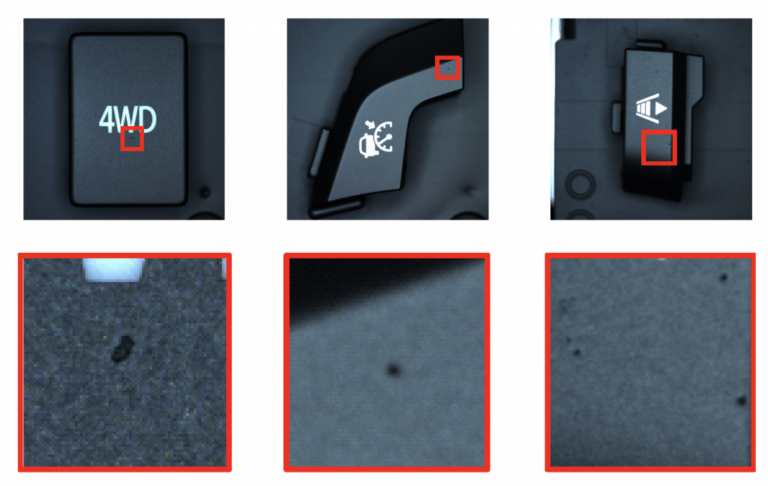
The data sets used consist of image data of three types of car parts (Figure 1). When observed closely, in some cases, a black spot can be seen on the front surface. This abnormality is called the “spot”. The size of all RGB image data of the data set is 1024 × 1024 pixels.
The data set is composed as follows: part A, with 108 normal and seven abnormal data items; part B, with 108 normal and six abnormal data items; and part C, with 146 normal and eight abnormal data items. They exhibit the characteristics that abnormal portions are small (the region corresponding to a “spot” is about 10 × 10 pixels in size, compared to the 1024 × 1024 pixels of the entire image), and the illumination and angle of all images are uniform, but the background is not.
Flow of the proposed method
The flow of the proposed method is as follows.
- Extract abnormal patterns from abnormal images for learning.
- Store all normal images for learning in an empty normal class.
- Copy all images of the normal class and store in an empty abnormal class.
- Then, at the time of reading an image from the abnormal class during the learning phase, attach to the image an abnormal pattern from (1) in a random place (but within the object’s region). During the attachment, the pattern undergoes size change and DA.
- DA is applied to improve robustness against pixel misalignment between images of normal and abnormal classes. The final input images for learning are thus obtained.
Evaluation and verification
In order to verify the effectiveness of using synthetic images for learning, we performed comparative experiments against learning without using synthetic images. For the learning process using synthetic images, an abnormal learning image is used to extract the abnormal pattern, and the abnormal image actually used for learning is the one copied from a normal learning image.
An 18-layer ResNet was used as the Convolutional Neural Networks (CNN) architecture. As the initial weights of the network, we used those corresponding to 1000-class classification learning using ImageNet, and the output layer is changed from the one for 1000-class classification to the one for 2-class classification.
After preparing synthetic images, images of size 1024 × 1024 pixels are converted into 512 × 512 pixels for dimensionality reduction. Moreover, in order to improve robustness against pixel misalignment, a random crop is carried out on both normal and abnormal classes (cutting 500 × 500 pixels at random from 512 × 512 pixels) to obtain the final input images.
In anomaly detection, the ideal would be not to let abnormal data be considered normal, and therefore the recall (the percentage of correctly discriminated abnormal data compared to the actual number of abnormal data) for the abnormal class is emphasized as an evaluation index.
Gradient-weighted Class Activation Mapping(Grad-CAM) is used to show the reason for discrimination. The importance of each pixel of an image for the output value of a specific class is shown as a heat map.
Experimental results
The discrimination reason is shown as a heat map (Figure 2). The “data” in the figure correspond to evaluation data (the red rectangles are correct abnormalities), and “result1” (no synthetic images) and “result2” (with synthetic images) are the results when Grad-CAM is applied. The deeper the color of the red portions within the image, the more meaningful the areas are in terms of the discrimination reason. The circles at the right top indicate discrimination failures.
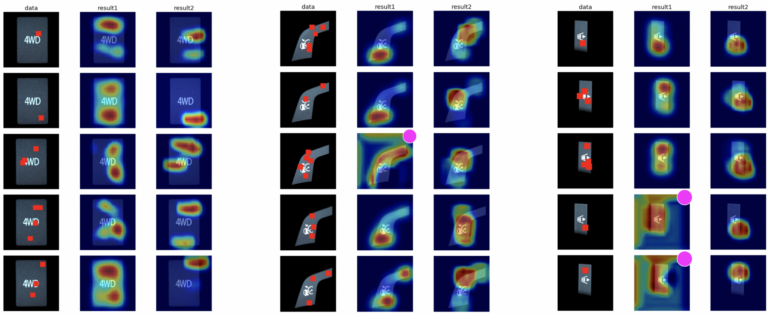
In the model with synthetic images, the recall for all parts reached 100%, and at least 80% of parts within the normal class were correctly discriminated. In the model with no synthetic images, the recall reached 100% for part A, and less than 100% for parts B and C. Moreover, the visualization results of discrimination reasons show that, in general, the model that includes synthetic images tends to use the abnormal portion as the discrimination reason.
The reason why including synthetic images yielded better results was that abnormal patterns were attached in several random locations, helping the learning process to attribute the discrimination reason to the abnormal portion. Moreover, the fact that it was possible to perform learning using 50 normal images and just one abnormal image indicates that the method is practical, with a low data-gathering cost.
To obtain discrimination time, we measured the time required since the input of an original image, including data formation, model feeding, and output of the discrimination result, and computed the average and standard deviation for 100 repetitions per image. We obtained an average 0.365 seconds even without using the Graphics Processing Unit (GPU), attaining our target of requiring less than one second.
Results and proposal
In the present research we tried to complement abnormal image data by means of augmentation, using synthetic images in order to solve the abnormal data shortage problem of supervised DAD. The objective was to build a discriminative model for high-performance anomaly detection.
We achieved our three initial conditions for all parts. In other words, we can conclude that the proposed method can be implemented as a practical anomaly detection system. It exhibits good accuracy and a short discrimination time, and also enables the visualization of the discrimination reason.