
Abstract
Background and issues
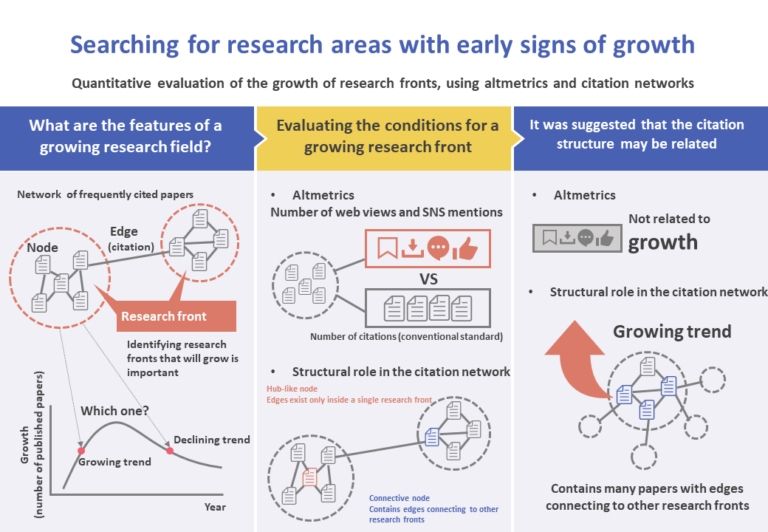
To be able to assess the strength of their own research work, find promising researchers, and allocate budgets in an effective manner, the Government and research institutes must be able to discover the seeds of new research areas. This is achieved by searching for groups of papers formed by ‘core papers’ (papers that have been heavily cited in the previous five years), referred to as the ‘research front’.
However, some research fronts may be declining while others may be emerging. It is important to evaluate research fronts in a quantitative manner, to determine which of them will tend to contain an increasing number of papers (grow), and the necessary conditions to achieve that.
Quantitative evaluation of research based on the number of citations is a longstanding practice. However, there are problems, such as differences between fields and difficulty in performing immediate evaluations. In view of that, a variety of measurable data referred to as ‘altmetrics’, such as the number of web views and SNS mentions, is attracting attention as an alternative, complementary method of quantitative evaluation.
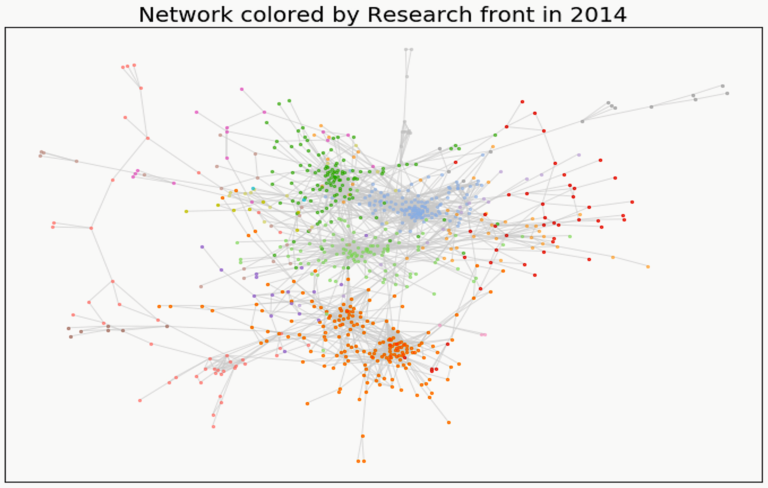
Note that a research front search is done by means of clustering (division into groups) of the citation network. The citation network is a graph structure, having papers as nodes and citation relations between them represented as edges.
It is worth noting the structural role played by the node; i.e., what function (a hub-like function, or a function of connecting to other clusters, etc.) the node is responsible for in the cluster (set of nodes).
So far, there has been no research to clarify the relation between research fronts and altmetrics. There has been no quantitative analysis of their relation with the structural role in the network.
In the present research we define a research front’s growth as the increase in its number of papers. We clarify the features that characterize a growing research front by performing a quantitative evaluation based on the altmetrics of the papers in the research front (number of views on the web, number of SNS mentions, etc.) and the citation network.
Data used
In the present research we first selected the 1% most-cited papers in each publishing year from among 158,732 papers published between 2010 and 2016 in the online journal PLOS ONE, after deleting data that were inappropriate or unnecessary for the purpose of the research.
These data were split into three data sets of five years, with overlapping periods: papers published between 2010 and 2014, between 2011 and 2015, and between 2012 and 2016. We call them respectively data2014 (1057 papers), data2015 (1283 papers), and data2016 (1381 papers).
For each paper, we obtained its publication year, keywords, references cited, and the accumulated number of citations and altmetrics (number of views, bookmarks, and SNS mentions) from its publication date to November 26, 2019.
The citation network was constructed using an existing method. Citation networks based on bibliographic coupling (the relation between papers B and C when they cite the same paper A) were built for each data set. Each edge was weighted based on three parameters: difference in publication years, similarity of references cited, and keyword similarity.
Using Newman’s method (a hierarchical aggregative clustering method), we obtained about 20 research fronts per data set. Next, we found the proportion of papers with overlapping research fronts in data sets with continuous periods. These research fronts were defined to be continuous if that proportion exceeded a threshold.
Eight continuous research fronts were found within the data sets used. Among them, we used six research fronts that were found throughout the entire period (the ones that were found in every data set).
Data analysis
First, we analyzed the relation between the growth of research fronts and altmetrics.
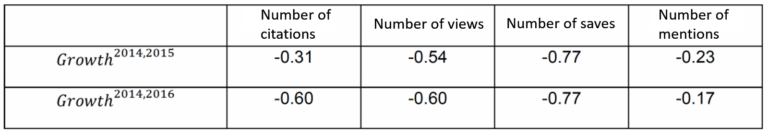
Defining the growth of a research front as the increase in its number of papers, we computed Spearman’s rank correlation coefficients (a statistical method to find the correlation coefficient between two variables) between the number of citations and values derived from altmetrics. However, no significant correlation was found with respect to the increase in the number of papers (Table 1).
Next, we analyzed the relation between a research front’s growth and the structural role played in the citation network.
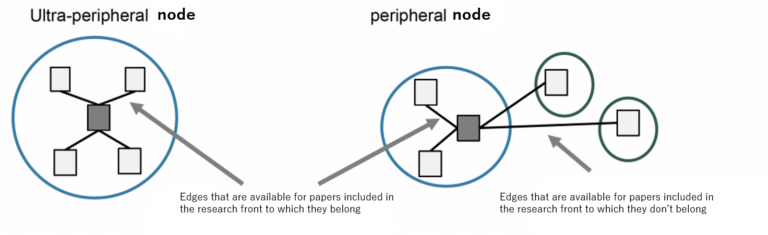
In the citation networks of all data sets, 95% of the papers have almost all edges placed within the cluster where the node belongs (ultra-peripheral) (Figure 1, left), and/or most of the edges placed within the cluster where the node belongs (peripheral) (Figure 1, right).
First, for each data set, we computed the proportion of ultra-peripheral and peripheral nodes by publication year. In all data sets, the proportion of ultra-peripheral nodes decreases and that of peripheral nodes increases as the publication year becomes more recent.
Next, we found the relations among the number of citations and altmetrics, and the proportion of ultra-peripheral and peripheral nodes for each research front, by calculating Spearman’s rank correlation coefficients. In the case of data2016 only, we found a significant negative correlation between the number of citations and the proportion of ultra-peripheral nodes. Conversely, a significant positive correlation was found with the proportion of peripheral nodes.
The number of views, saves, and mentions showed a similar trend. A significant positive correlation was found between the proportion of peripheral nodes and the number of saves and mentions.
The relation between the growth rate and the proportion of ultra-peripheral and peripheral nodes for each research front was found by computing Spearman’s rank correlation coefficients. The growth rate from data2014 to data2016 was positively correlated with the proportion of peripheral nodes (Table 2).
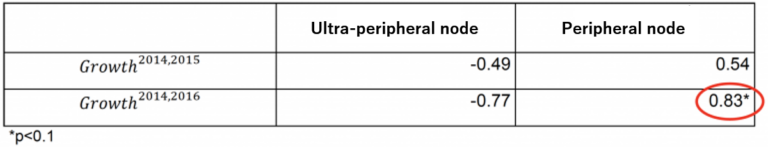
In other words, the more recent a paper’s publication year, the larger the number of edges connecting to papers not included in the research front. For recently published papers, the larger the number of papers classified as having peripheral nodes in the research front, the larger the number of citations and altmetrics indices.
Results and proposal
We could not conclude that the altmetrics considered in the present research (number of views, saves, and mentions) contribute to the growth of research fronts.
A possible reason is that the number of views and saves of a paper includes its use by people other than researchers, and therefore such numbers do not reflect the amount of attention it received from researchers. Moreover, most such papers are never or rarely mentioned in SNS, and consequently do not become a factor for increasing the number of papers.
It was found that research fronts containing a large number of edges connecting not only to papers within that research front but to papers in other research fronts tend to show an increase in the number of papers. It seems that the structural role played in the citation network influences the growth of the research front.
Papers with their edges connecting to papers in other research fronts are possibly multidisciplinary (they span multiple fields). It can be said that these research fronts constitute a multidisciplinary field and can accommodate papers written by researchers in a variety of areas, resulting in an increasing number of papers.