
Abstract
Background and Issues
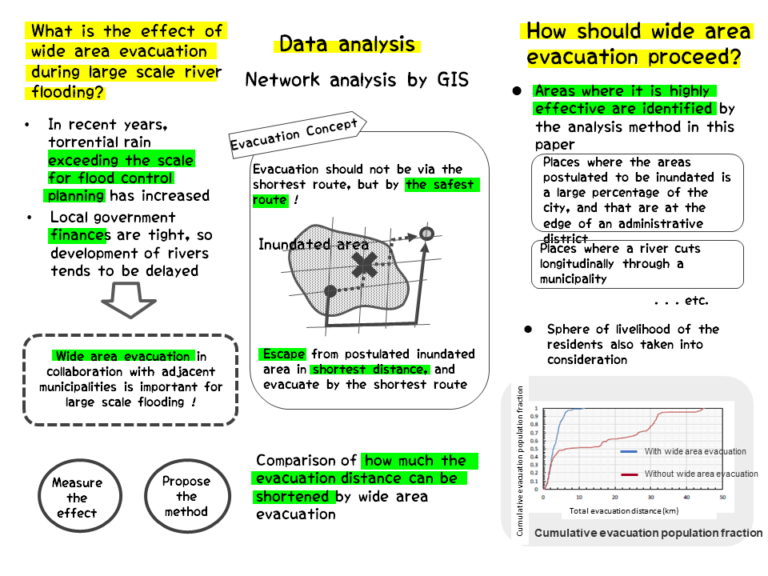
- In recent years the frequency of occurrence of rainfall that exceeds the planned scale for flood control, such as short period concentrated torrential rainfall, etc., has increased (Japan Meteorological Agency, 2020), but as the government financial situation is tight, development work on rivers, etc., has been delayed
- The risk potential is increasing due to expansion and concentration in the major cities of population, economic activity, and property, so concern regarding the occurrence of large scale flooding is increasing
- At Joso City in the 2015 Kanto and Tohoku torrential rain, opening of evacuation centers was given priority and the evacuation order was delayed, so the issue arose that both government and the public were unable to distinguish between evacuation (evacuation from dangerous areas) and sheltering (provision of temporary accommodation) (Joso City Flood Countermeasures Verification Committee, 2019)
- Flooding is a progressive disaster that occurs as a result of hazard increasing cumulatively and reaching a certain threshold. Since weather and evacuation information is announced before a dangerous situation occurs, and safety can be ensured in advance.
- It is necessary to investigate specific approaches to developing a wide area evacuation plan in the event of a large-scale flood (Cabinet Office, 2020)
In this research the effect of wide area evacuation was measured, focusing on escape from inundated areas. Also, the method has been proposed.
Analysis
Overview of the Analysis
| Analysis Target Area | Analysis Target Area Municipalities in Ibaraki Prefecture |
| Analysis Method | Network Analyst analysis by GIS |
| GIS Data | Road network (DRM digital road maps 2014 version) Evacuation facilities (PAREA-Hazard evacuation center data 2016 version) Postulated inundation areas (Digital National Land Information) Population on a 500 m mesh (Digital National Land Information) Administrative areas (Digital National Land Information) Rivers (Digital National Land Information) |
Analysis Method
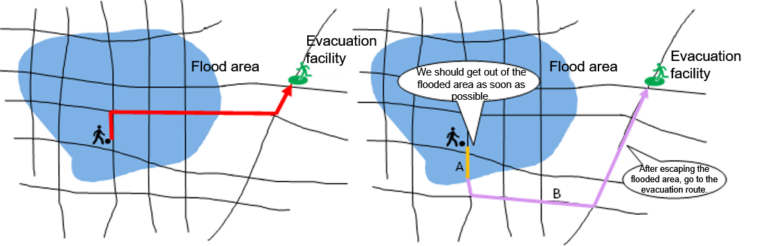
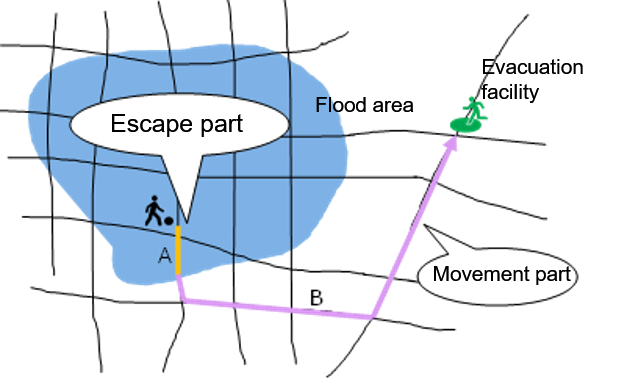
- Evacuation behavior concept: Considering the importance of evacuating quickly from areas subject to flooding risk, it is assumed that after evacuating the flooded area in as short a time as possible, people will go to the evacuation facility nearest to the evacuation point (Fig. 1).
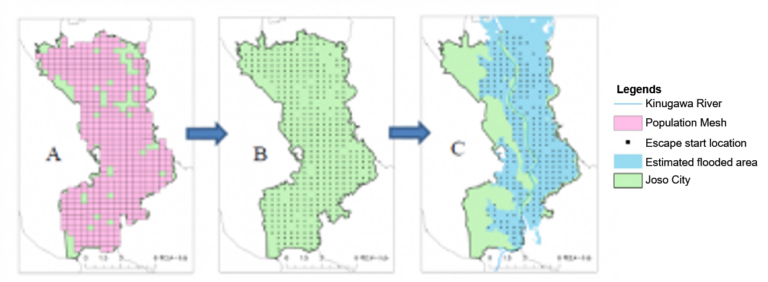
- Setting of points for start of evacuation: Using the “Population on a 500 m mesh (A in Fig. 2), the centroid of each 500 m population mesh was produced (B in Fig. 2). Within these, those that were included in inundation areas (C in Fig. 2) were identified and defined as the starting points for evacuation. The total of the populations of each evacuation starting point was taken to be the population requiring evacuation for the city.
- Evacuation destination setting: It was assumed that evacuation facilities outside the inundation areas only would be used during a flood (however, welfare evacuation centers, which are secondary evacuation centers, were not used in this research)
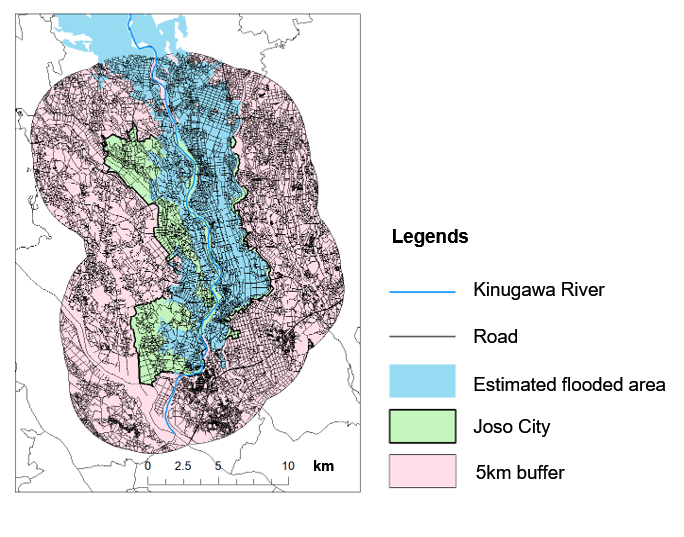
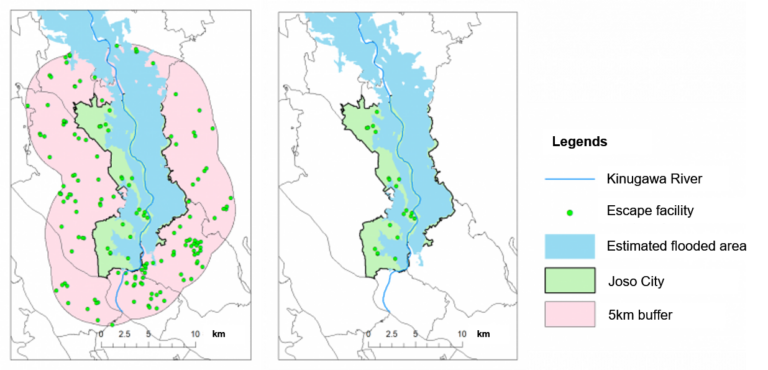
- Road network setting: Road network data included in a 5 km buffer produced from the administrative region of the municipalities being analyzed was extracted for use (Fig. 3)
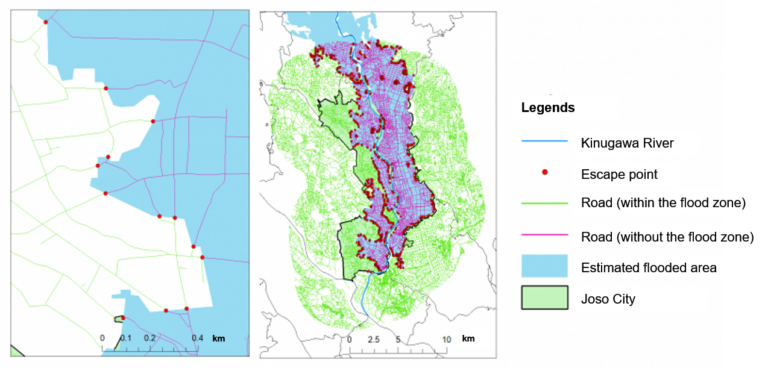
- Production of inundation area escape points: The road network data was divided into areas inundated and areas not inundated, the points of connection of the road networks within inundated areas and outside inundated areas were extracted, and taken to be escape points (Fig. 4)
- Setting of escape parts and movement parts: From starting points to escape points were set as escape parts, and from escape points to evacuation facilities were set as movement parts (Fig. 5)
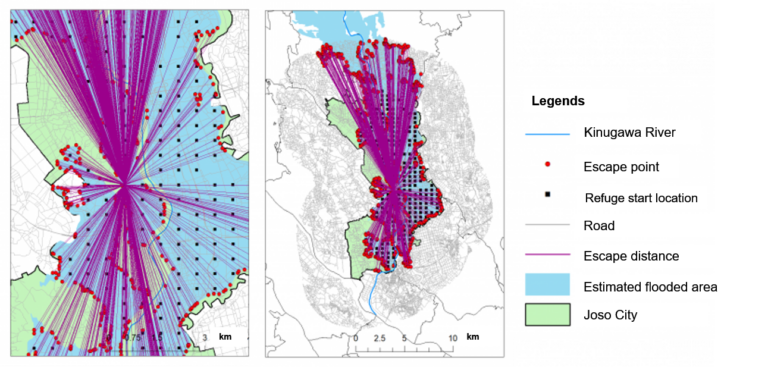
- Analysis of escape parts: Evacuation starting points were set as the origins, and the escape points of inundation areas were set as the end points (Fig. 6). The straight line distances are shown in Fig. 6, but actual distance data was obtained.
- Analysis of movement parts: To prevent selection of routes within inundated areas again after passing through escape points, the road network outside the inundated areas (the green part in Fig. 4) was used. The escape points were set as starting points, and the evacuation facilities were set as end points. To measure the effect of wide area evacuation, two cases were analyzed, wide area evacuation implemented and wide area evacuation not implemented, and their respective evacuation distances were compared and evaluated. In the analysis of the case where wide area evacuation was implemented, evacuation facilities included in the 5 km buffer produced from the administrative area that was the target of analysis were set as end points (Fig. 7 left). On the other hand, in the analysis of the case where wide area evacuation was not implemented, only evacuation facilities included in the municipality that was the target of analysis were set as end points (Fig. 7 right).
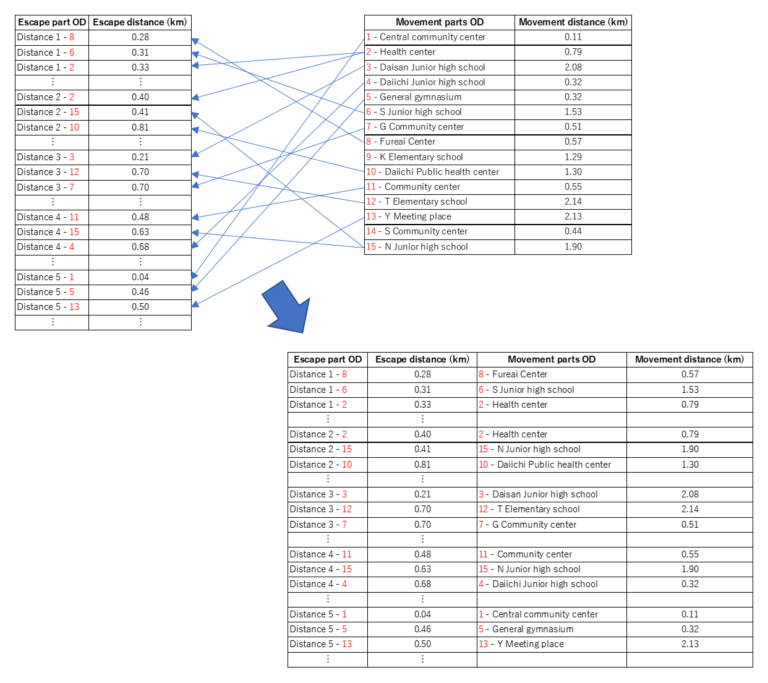
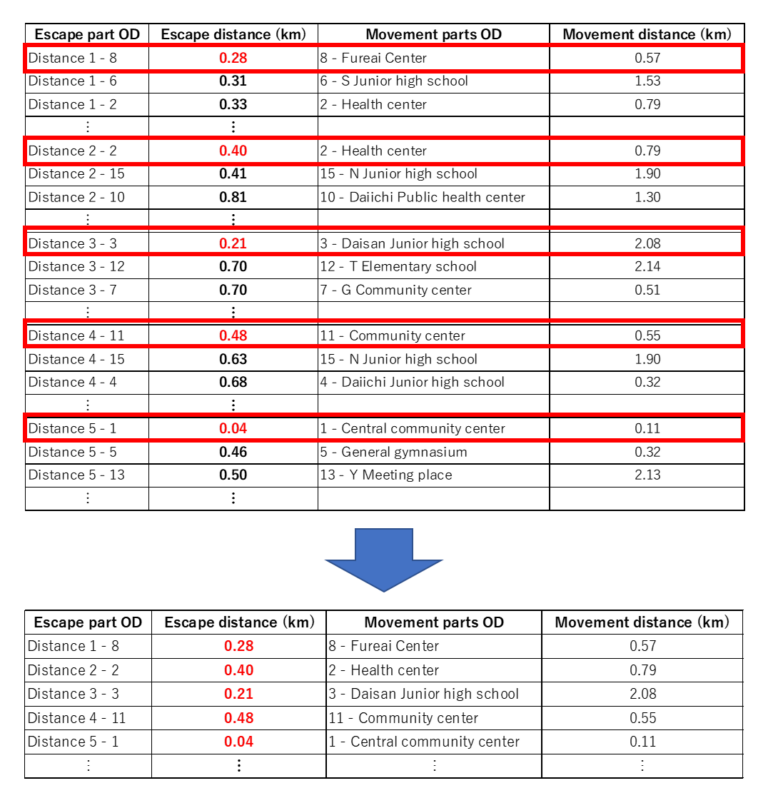
- Connecting escape parts and movement parts: Finally the OD data for the escape parts and for the movement parts were combined (Fig. 8), and the data was selected to identify the final evacuation routes. Specifically, the same evacuation starting point data overlapped, so the routes with the shortest evacuation distances were extracted (Fig. 9) so that a single point of data was obtained for each evacuation starting point.
- Calculation of the change in evacuation distance per person by implementation of wide area evacuation: For each evacuation starting point, [(population) × (distance)] was calculated to obtain population-weighted distance data. Next, these were summed, and the total population requiring evacuation, the total population-weighted evacuation distance, the total population-weighted escape distance, and the total population-weighted movement distance were calculated. Finally, the average total evacuation distance, escape distance, and movement distance per person in the population requiring evacuation were calculated.
- Calculation of the change in evacuation distance for each evacuation starting point: To calculate the change in evacuation distance for each evacuation starting point, [escape distance with wide area evacuation] – [escape distance with no wide area evacuation] was calculated. The movement distances and total evacuation distances were calculated in the same way.
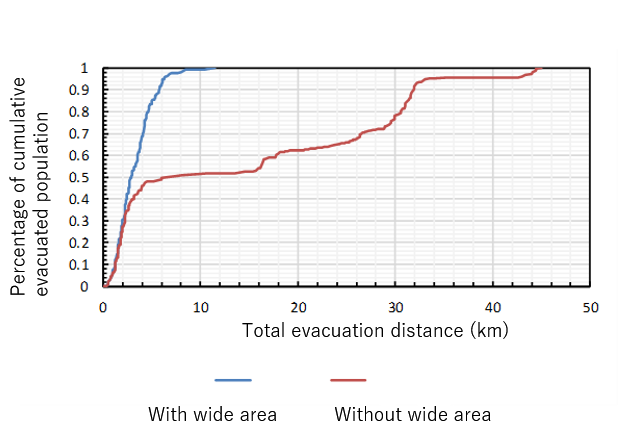
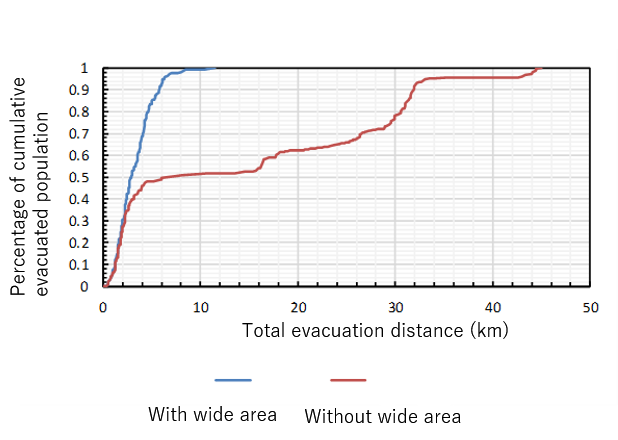
- Calculation of the trends in evacuation population by evacuation distance: The evacuation route data obtained was arranged in ascending order of evacuation distance. The cumulative fractions of evacuation population along the arranged sequential order was calculated. By superimposing the results according to whether or not wide area evacuation was used, Fig. 10 was obtained.
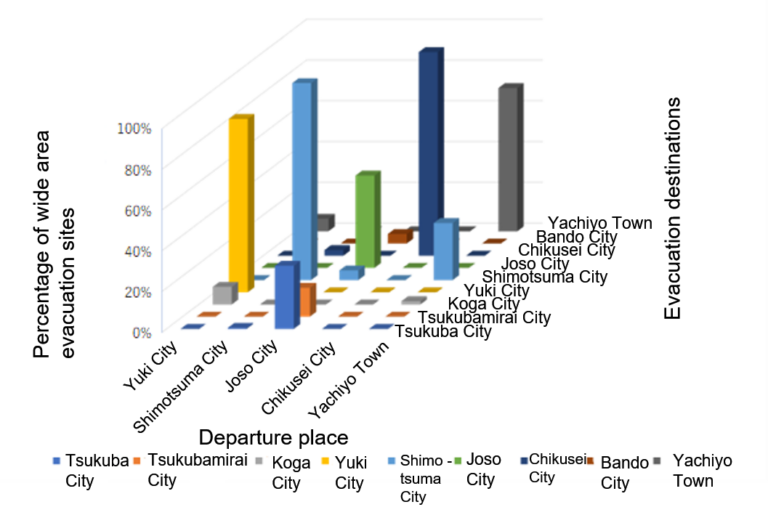
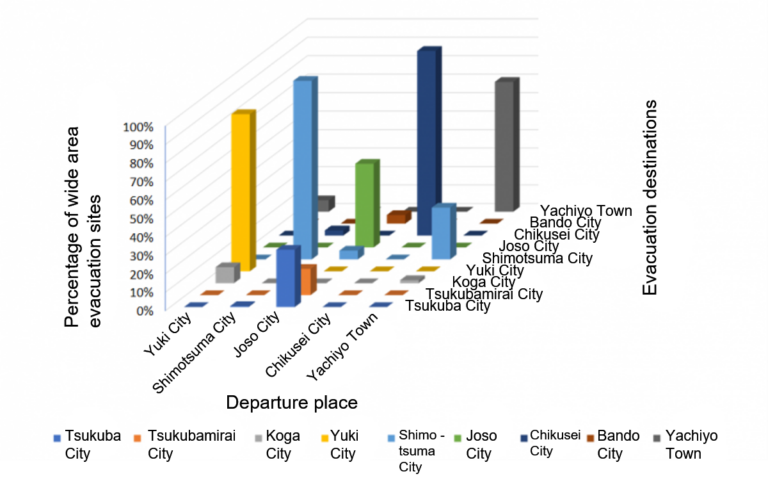
- Calculation of fraction of evacuation destination municipalities when wide area evacuation was implemented from target municipality: Results were summed for respective municipalities that were evacuation destinations, and the fractions were calculated. The results for municipalities adjacent to the river being analyzed were expressed in a 3D vertical column chart (Fig. 11).
Kinugawa River Analysis Results
- The above analysis was performed for all 11 flood forecast rivers postulated by the Ministry of Land, Infrastructure, Transport and Tourism. Of these, the analysis results for the Kinugawa River on the Tone River system are introduced here. (Refer to the main document for the complete results)
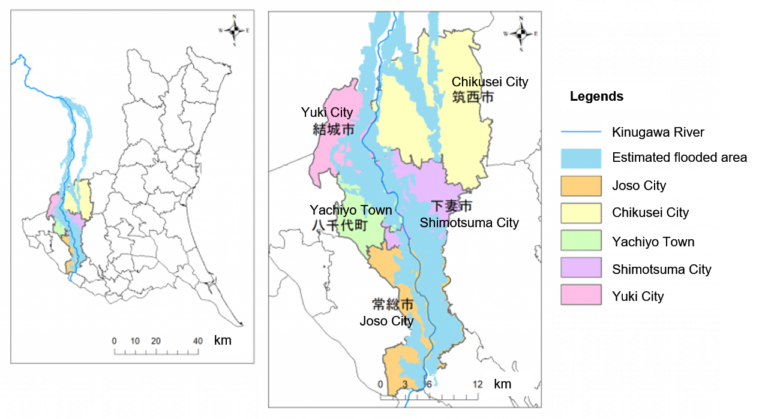
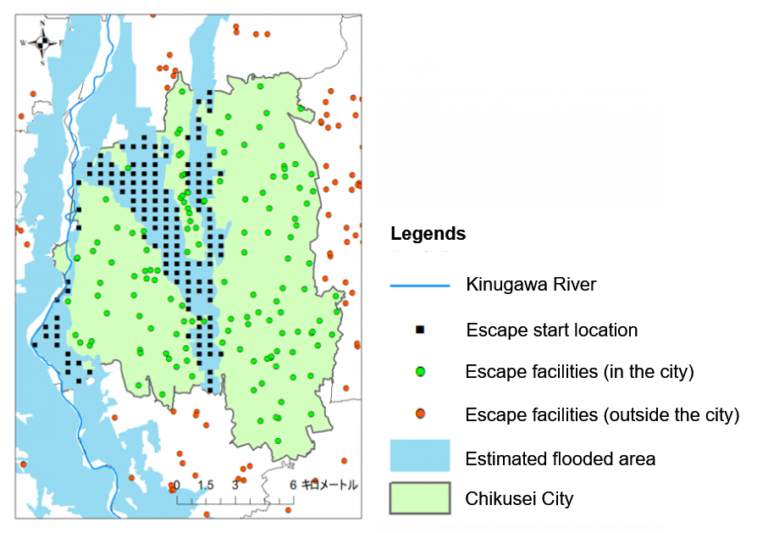
- The municipalities at risk of inundation in the event of flooding of the Kinugawa River, and therefore requiring evacuation of the residents of the inundation areas, include Joso City, Yuki City, Shimotsuma City, Chikusei City, and Yachiyo Town (Fig. 12).
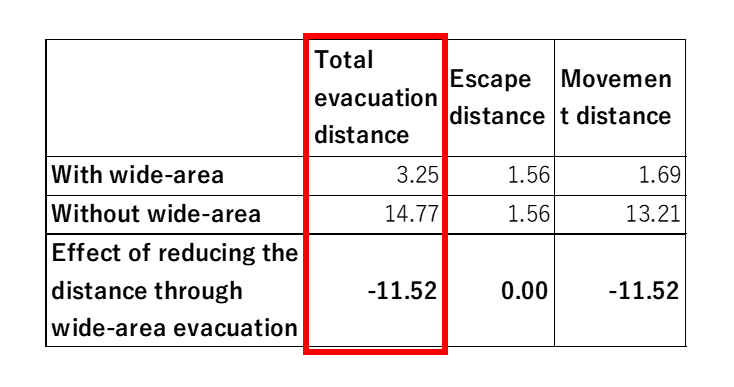
- As a result of arranging the municipalities analyzed in descending order of the degree of effect of wide area evacuation, Joso City stood out for its large effect, and others were 0.3 or less (Table 1). The effect of reduction in average total evacuation distance per person of the population requiring evacuation was 11.52 km (Table 2).

- Looking at the cumulative evacuation populations (percentages) for each evacuation distance, it can be seen that the evacuation distance for the city as a whole was greatly shortened as a result of implementing wide area evacuation (Fig. 13)
- Fig. 14 shows on a map of the areas in Joso City where an effect of wide area evacuation was found. This is because there are extensive inundation areas, and to go from the east side of the city to the evacuation facilities within the city it is necessary to make a large detour.

- On the other hand, in Chikusei City, there was no change in evacuation distance regardless of whether or not wide area evacuation was implemented, so there was no effect of wide area evacuation. (Table 3) This was because the areas postulated to be inundated as a percentage of the city area was small, and sufficient evacuation facilities could be used within the city (Fig. 15).

- Looking at the fractions of municipalities that are evacuation destinations (Fig. 16), in the case of Joso City there are many adjacent municipalities, and most of the city was inundated, so many of the evacuees dispersed into other municipalities. In the cases of Yuki City, Shimotsuma City, and Yachiyo Town, wide area evacuation was required in a part of the area, and most residents evacuated within their own municipalities.
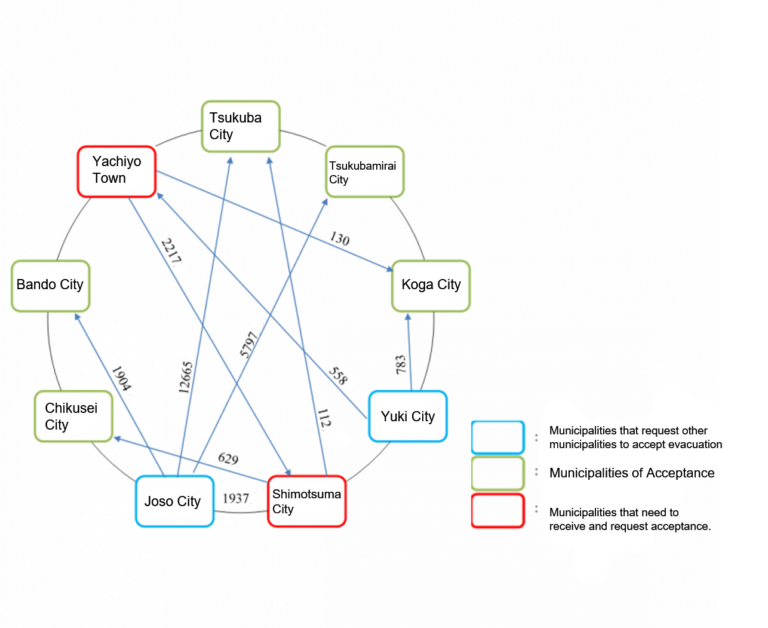
- Finally, we look at the relationship between municipalities where wide area evacuation was implemented (Fig. 17). However in the following figure, the number of people that evacuated to within their own city has been omitted, and the number of people in wide area evacuation to other municipalities is shown.
Recommendations
- A method of analysis using GIS was established for measuring the effectiveness of wide area evacuation, the effectiveness of wide area evacuation was compared at the municipality level, and areas where it was particularly effective were identified for each municipality
- Geographical characteristics of areas where the effectiveness of wide area evacuation is high
- Places where the areas postulated to be inundated is a large percentage of the city, and that are at the edge of an administrative district
- Places where a river cuts longitudinally through a municipality
- Places where the boundary with adjacent municipalities is a river
- Places where the boundary with adjacent municipalities is continuous land
- Places where the wide area evacuation straddles prefectures
- Places where there is a high possibility of inundation of almost all the municipality
- Recommendations Based on the Results
– Efforts should be made to familiarize people with the difference between evacuation and sheltering, and to reflect the difference in evacuation plans
– Wide area evacuation measures should be promoted by government
– Evacuation destinations should be set taking into consideration the sphere of livelihood of the residents
References
Joso City Flood Countermeasures Verification Committee: Verification Report on the Response to the Kinugawa River Flooding at Joso City in 2015 – Preparing for Disasters as a Matter of Concern to Ourselves, published June 13, 2016
http://www.city.joso.lg.jp/ikkrwebBrowse/material/files/group/6/kensyou_houkokusyo.pdf (last accessed January 3, 2019)
Cabinet Office HP: Committee for Technical Investigation on Large-Scale Flood Countermeasures, http://www.bousai.go.jp/kaigirep/chuobou/senmon/daikibosuigai/index.html (last accessed January 3, 2020)
Japan Meteorological Agency HP: Changes in Torrential Rain, Extremely Hot Days, Etc. (Extreme Weather Phenomena) to Date,
https://www.data.jma.go.jp/cpdinfo/extreme/extreme_p.html (last accessed January 3, 2020)