
Abstract
Background and Issues
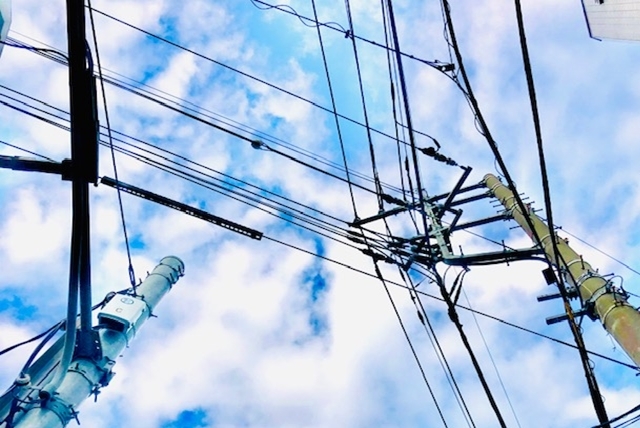
- Electricity poles have been toppled in the past as a result of disasters in Japan, where disasters frequently occur (Fig. 1), and in the 1995 Southern Hyogo Prefecture earthquake about 4,500 electricity poles were toppled, some of which obstructed the passage of emergency vehicles (Ministry of Land, Infrastructure, Transport and Tourism, 1995). Also, there has been significant toppling of electricity poles associated with typhoon damage in recent years (Fig. 2).
- It is said that about 3 electricity poles were toppled per day in the period from May until September 2015 as a result of typhoons (The Network for Non Pole Community, 2018)
- It has been reported that 84 electricity poles were toppled in Typhoon 15 in September 2019 (Tokyo Electric Power Company Holdings, 2019)
- The annual rate of increase in the number of electricity poles is 70,000 (Ministry of Land, Infrastructure, Transport and Tourism, 2016), and their maintenance cost per kilometer per annum is about 1.14 million yen
- However, the population of Japan has peaked in 2008, and is predicted to decrease until at least 2065 (National Institute of Population and Social Security Research, 2017)
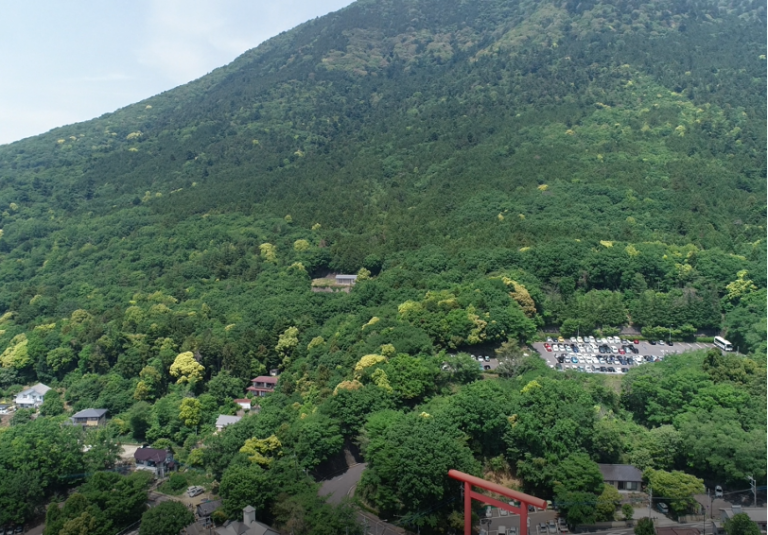
- In addition, in intermountain regions and rural regions with farmlands, a large number of electricity poles and power cables are provided for a small number of buildings (Fig. 3)
- At present electricity poles and power cables are used as a means of universal service, but taking into consideration the maintenance cost per unit of demand, some method other than the existing power distribution method is required for these areas
- It is necessary to investigate elimination of electricity poles by installing electrical power cables underground (eliminating electricity poles) and providing off-grid power supply (eliminating both electricity poles and electricity cables)
- Although investigations have been conducted in the fields of civil engineering, architectural engineering, urban planning, operations research, etc., on the effect of elimination of electricity poles and ensuring routes during disasters, including the effect on the scenery (Ishida, 2011), the effect on pedestrian behavior (Li, 1998), and the effect beneath ground level (Park, 2017), no detailed investigation has been carried out using the actual positional information of electricity poles
↓
In this research, the effect of elimination of electricity poles during a disaster was verified, and the effect of introduction of off-grid power supply in sparsely populated areas was verified, using actual electricity pole positional data, in order to investigate how elimination of electricity poles should be implemented
Analysis
Main Analysis Data
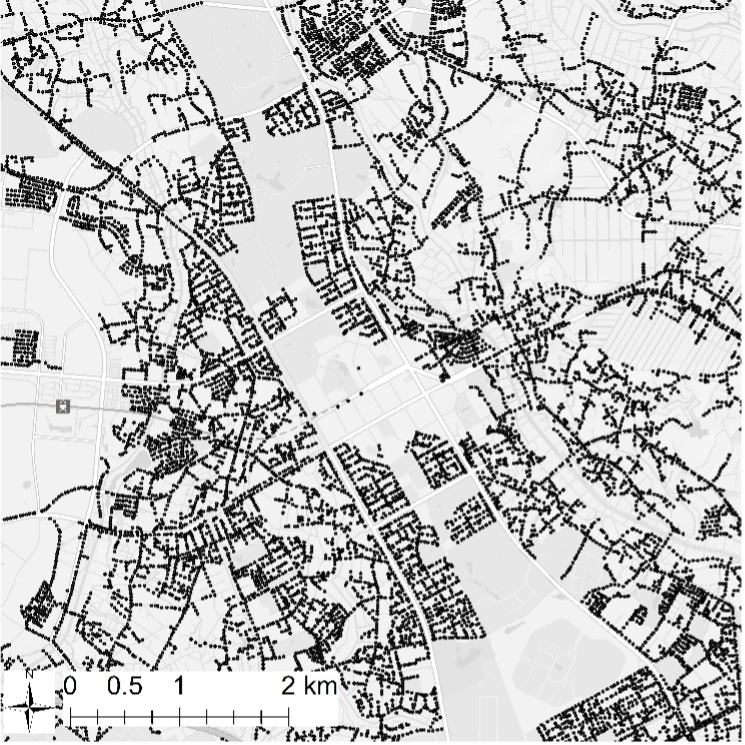
For the electricity pole positional information, the latest data between October 2018 and June 2019 for 20 municipalities in Ibaraki Prefecture was used (Tepco Town Planning Co., Ltd.)
Analysis of Factors Relating to Number of Electricity Poles
- By performing regression analysis with the number of electricity poles in a 500 m mesh as a dependent variable, it was found that there was a positive correlation between the number of electricity poles and the population, total road length, and urbanization-designated area dummies
- In particular, electricity poles are densely concentrated in urbanization-designated areas; 30% of all the electricity poles are distributed in such areas, occupying about 10% of the area of a whole city
Pareto Optimum Route Analysis Between City Offices 1
- Envisaging the supply of emergency goods and transit of emergency vehicles between municipalities during a disaster, the Pareto optimum (here indicating the state in which when either speed or safety are improved, the other must deteriorate) routes were obtained, taking into consideration the trade-off between speed (how short the traveling distance is) and safety (how low the potential for road blockage due to toppled electricity poles is) for routes connecting government office to government office
- The Pareto optimum routes between Tsuchiura city office and Kasumigaura city office calculated based on the actual electricity pole positional information were identified as the shortest route between city offices, and the fewest electricity pole route that passes the smallest number of electricity poles but whose distance is longer, route r1 that mainly passes through National Route No. 6, and route r2 that passes through and does not detour the urban area around Tsuchiura Station, where there is a dense concentration of electricity poles (Fig. 4)
Fig. 4: Pareto optimum route between city offices
Pareto Optimum Route Analysis Between City Offices 2
- Of the roads that connect the city offices, only those designated as emergency transport roads during a disaster were extracted, and when recalculation was performed assuming that the number of electricity poles was 0 in all cases, route r1, which was close to the shortest route, became the route with the fewest electricity poles
- In other words, there is a possibility of achieving both speed and safety to a certain extent by eliminating electricity poles on emergency transport roads (Fig. 5)
Fig. 5: Emergency transport roads and optimum route after elimination of electricity poles
Pareto Optimum Route Analysis Using Concentric Circle Model
- A more general situation was considered, using a concentric circle model to model radiating and loop roads, as a simplified model of the real world (Fig. 6)
Fig. 6: Setting of variables in the concentric circle model
- It was assumed that the electricity pole density in the urbanization-designated area is 1, and the electricity pole density in the urbanization control areas is ρ, which is less than 1 (for example, 0<ρ<1). A total of six combinations was considered by combining traveling patterns (outside → outside, outside → inside, inside → inside) and the magnitude of angular difference θ between lines connecting the center of the circle and the origin (O), and the center of the circle and the destination (D) (θ < 2 [rad], or θ > 2 [rad]).
- The shortest route and the route with the fewest electricity poles were obtained for each of these combinations, and as a result of investigating the Pareto optimum regions, the following was found
– The Pareto optimum routes were concentrated on zone boundary roads
– The Pareto optimum curve was not necessarily continuous, but could be expressed as points and lines
– As the difference in density of electricity poles in zones is reduced, the Pareto optimum assembly was reduced
→ Considering routes with an awareness of disasters, it is considered effective to eliminate electricity poles on roads passing close to the boundaries of zoning where the Pareto optimum is concentrated
⇒ For example, when eliminating electricity poles, instead of simply developing entire urbanization-designated areas where there are many electricity poles, it is more effective to develop the portions at the zoning boundaries, or to develop roads that directly connect from the outskirts to the center
Analysis of the Effect of Introduction of Off-grid Power Supply 1
- Next, in order to consider the effects of introduction of off-grid power supply and the appropriate areas for this, the electrical distribution network including electricity lines was considered
- For this analysis it was necessary to determine the connections between electricity cables, but this data was not available, so a virtual electricity distribution network was constructed using electricity poles as nodes and electricity cables as edges, using proximity graphs
- The Minimum Spanning Tree (MST) was selected as an approximation to the actual electricity distribution network, while carrying out a field survey, and the relationship between electricity poles and the number of adjacent buildings (within 50 m) on the virtual electricity distribution network was observed
- Here, the fewer the number of adjacent buildings (number of buildings per electricity pole) and the fewer the number of other adjacent electricity poles, the lower the effect on the residents, so the greater the effect of reduction of electricity poles, so the area had a higher priority for off-grid power supply
- Kamisugama and Nakasugama, Sakura in Tsukuba City, and Sakuramachi in Tsuchiura City were selected as examples of rural areas, residential areas, and urban areas, respectively, for performance of the analysis
→ The electricity pole with the highest closeness centrality (a value that is higher the smaller the sum of the distances to other nodes within any distance range) was assumed to be the “center electricity pole”, and a directional graph was constructed from the terminal node of the graph towards the center electricity pole, and the relationship between the number of electricity poles and number of buildings was plotted, producing the following figure (Fig. 7)
Fig. 7: Effect of off-grid power supply using actual data
- Unlike the residential area and urban area, where the relationship between the two was almost linear, in the rural area a relatively large number of electricity poles were found with a small number of buildings per electricity pole (thus, number of residents affected by off-grid power supply was small) while at the same time with a comparatively large number of adjacent electricity poles (thus, the effect of reduction of electricity poles by off-grid power supply is large) (for example, at the locations circled in red in Fig. 7)
- The number of buildings and the number of electricity poles in each area was as shown in the following table (Table 1)
Table 1: Relationship between the number of buildings and number of electricity poles in each area
Analysis of the Effect of Introduction of Off-grid Power Supply 2
- Finally, assuming that the smaller the number of adjacent buildings and the smaller the number of other adjacent electricity poles, the higher the priority for off-grid power supply, an electricity distribution efficiency (the ratio of the number of buildings remaining on the electricity distribution network to the number of electricity poles) improvement effect due to off-grid power supply was found in the area within 5 km of Mount Tsukuba (Table 2)
Table 2: Improvement ratio due to off-grid power supply for each scenario
- For example, it was found that by taking the upper 1% of the order of priority electricity poles off-grid, there is likely to be an improvement effect of 6%
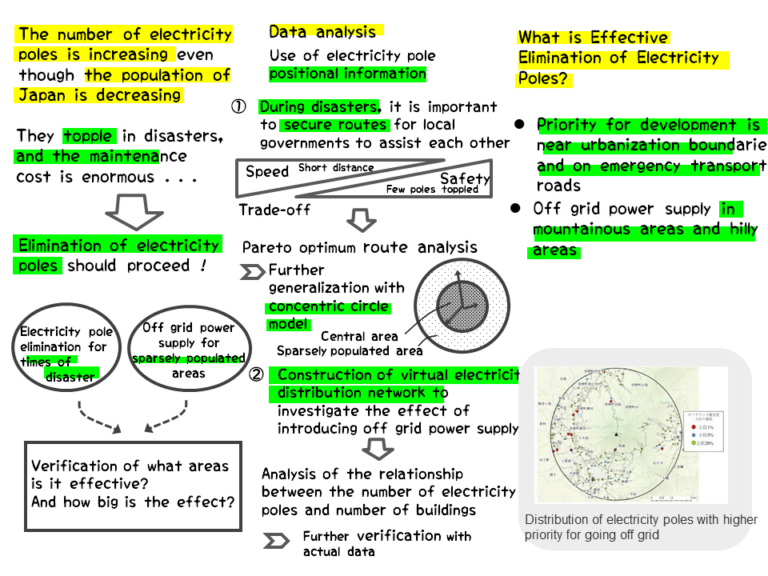
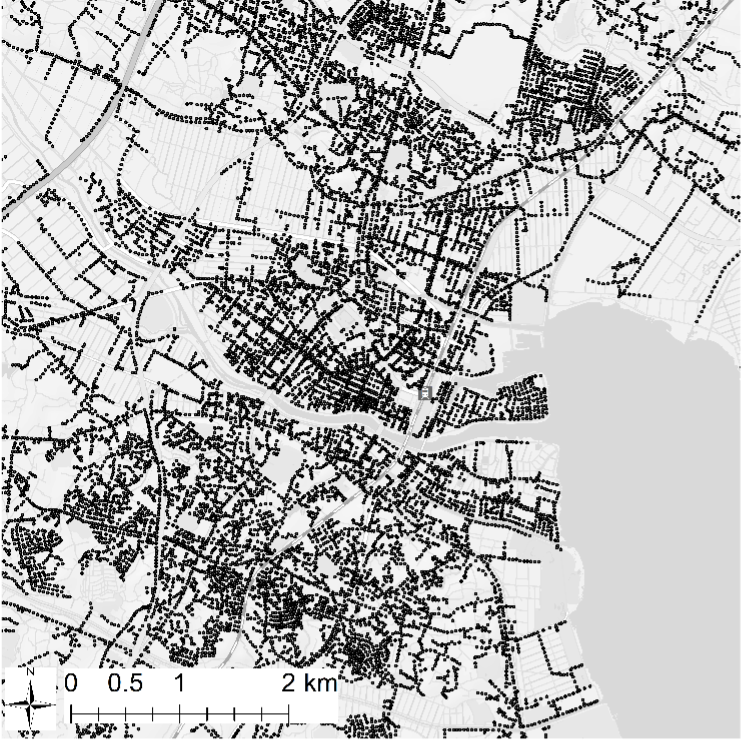
- It was found that the electricity poles with a high improvement effect due to off-grid power supply were mainly in forestry and agricultural areas (Fig. 8)
Fig. 8: Distribution of electricity poles with high order of priority for going off-grid
Recommendations
- From the foregoing analysis, the following is recommended
Elimination of electricity poles in cities is effective near urbanization boundaries and on emergency transport roads
Off grid power supply is effective in forestry and agricultural areas found in mountainous areas and hilly areas
References
Mainichi Shimbun: Typhoon 21: ground rumblings and a storm of impacts. Electricity poles and trees uprooted, Osaka morning edition September 6, 2018
Ministry of Land, Infrastructure, Transport and Tourism (2019): Status of Damage to Life Lines in the Great East Japan Earthquake and the Great Hanshin Awaji Earthquake, <https://www.mlit.go.jp/road/road/
Traffic/chicyuka/chi_13_06.html>, viewed November 2019
The Network for Non Pole Community (2018): I want to look up at the Japanese sky ☆ Recovery scenarios for the age of no electricity poles, Kamogawa Publishers
Tokyo Electric Power Company Holdings, Damage to the Facilities and Status of Power Outage in the TEPCO Power Grid, Inc. Service Area Due to Typhoon 15 [as of 10:00 am September 10], <http://www.tepco.co.jp/press/release/2019/1517283_8709.html, viewed November 2019
National Institute of Population and Social Security Research (2017): Estimated Population of Japan in the Future (estimate as of 2017), <http://www.ipss.go.jp/pp-zenkoku/j/zenkoku2017/pp_zenkoku2017.asp
Ministry of Land, Infrastructure, Transport and Tourism, Promotion of Elimination of Electricity Poles, Trend in Number of Electricity Poles 2016,<https://www.mlit.go.jp/road/road/traffic/chicyuka/chi_13_03.html, viewed November 2019
Shinji Ishida, Shiuchi Kameyama, Shoichi Nara, Junpei Miyazaka (2011), Research into Measurement of the Effect on Road Sequence Scenery of Elimination of Electricity Poles, Proceedings of the Japan Society of Civil Engineers D1, (Landscape design), Vol. 67, No. 1, pp. 1-10
LI Guoquan, Tomonori Sumi, Ken-ichi Teramachi (1998), Effects of Electricity Poles on Traffic Volumes on Narrow Mixed Pedestrian and Vehicle Roads and Pedestrian Safety, Proceedings of City Planning, Vol. 33, pp. 589-594
Park Yong Won, JANG Hee Soon, Takashi Yokota (2017), Analysis of the Factors by which Elimination of Electricity Poles Affect Land Prices, Proceedings of City Planning, Vol. 52, No. 3, pp. 1212-1217