
Abstract
Background and Issues
- Japan has a target of constructing and maintaining the world’s best Intelligent Transport System (ITS), contributing to Japan and the world (Strategic Conference for the Advancement of Public and Private Sector Data Utilization, 2020). By 2019, Level 2 (partial automation of driving) had been put into practical use.
- Further automation of driving will proceed in stages in the future, with the aim of introduction of Level 5 (complete automation of driving) in the 2030s (Strategic Conference for the Advancement of Public and Private Sector Data Utilization, 2020)
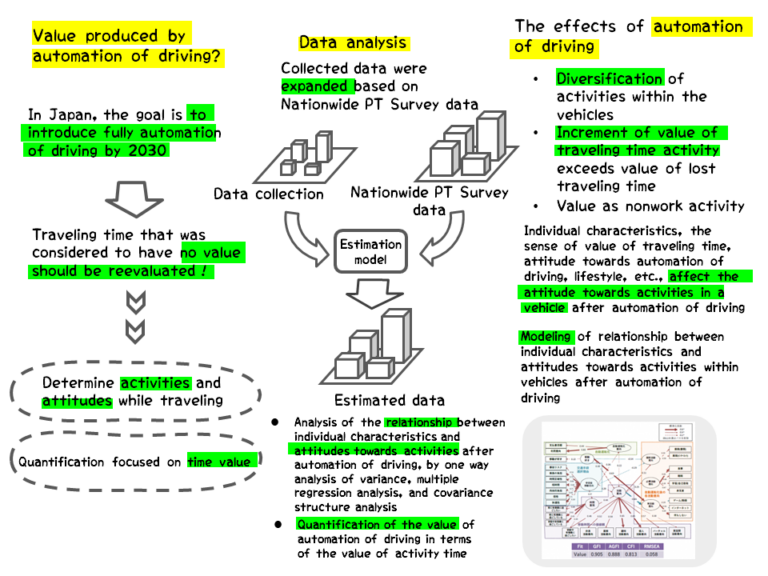
- To date it has been assumed when quantifying the effect of traffic measures that the time spent driving or traveling has no value, so traveling time should be reduced so that the reduced traveling time could become work time (Research Meeting on Road Traffic Time Value, 2012)
- It is necessary to determine traveling behavior focusing on the activities during traveling after driving has been automated
- Although a relationship between automation of driving and activities within a vehicle has been postulated (Joshua et al., 2011; Katsuki et al., 2017; Steck et al., 2018; Almeida Correia et al., 2019), there has been no research focusing on the factors determining activities within vehicles after automation of driving and its value
↓
- In order to clarify the use and value of time newly created by the realization of autonomous driving and to assist in future traffic planning and urban planning, a questionnaire survey was conducted regarding activities within vehicles and traffic behavior, to determine the actual status and attitudes regarding activities while traveling

– To expand the survey results, the survey included the same questions as the All Japan Urban Traffic Characteristics Survey (hereafter, the “All Japan PT Survey”)
– A stratified sampling was performed where 30 samples were extracted from each of the 80 segments of age group (five categories), city type (four categories), and work type (four categories)
– As a result of data cleaning 504 samples were removed, and analysis was performed on the remaining 1896 samples
Analysis
Attitudes Regarding Activities Within Vehicles before and after Automation of Driving
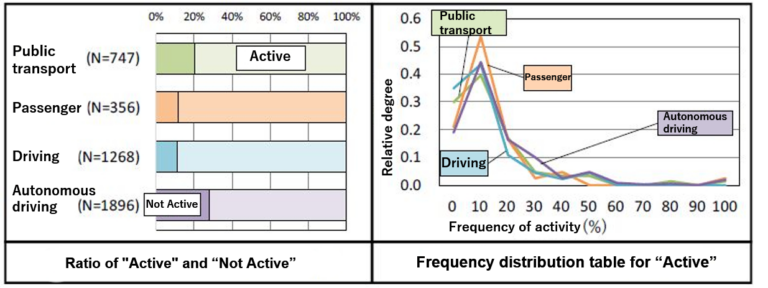
- Activities within vehicles were investigated for three current transport means, public transport (railway, bus) (hereafter referred to as “Public Transport”), automobile (as passenger), taxi (hereafter referred to as “Passenger”, and automobile (driving) (hereafter referred to as “Driving”), and the future transport means “Autonomous Driving”

- For all activities, similar trends were observed in terms of the percentages of people that were active and that were not active, between Public Transport and Autonomous Driving, and between Passenger and Driving
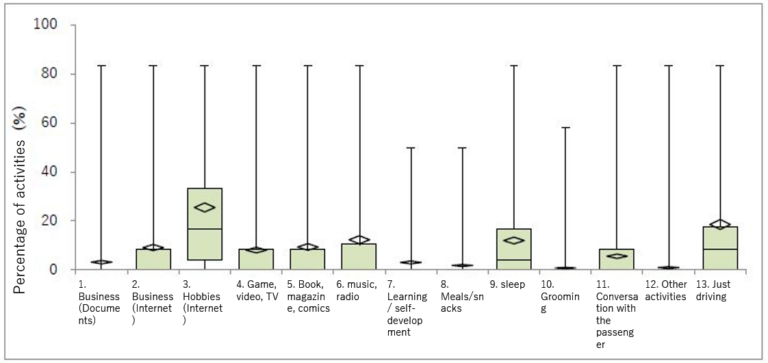
- Regarding work-related activities, the percentage of people active on Work (documents) will increase as a result of Autonomous Driving. The percentage of people active on Work (Internet) after driving has become autonomous will not change greatly from the percentage currently in Public Transport, but the activity percentage has increased as a result of the frequency distribution (Fig. 1, Fig. 2)
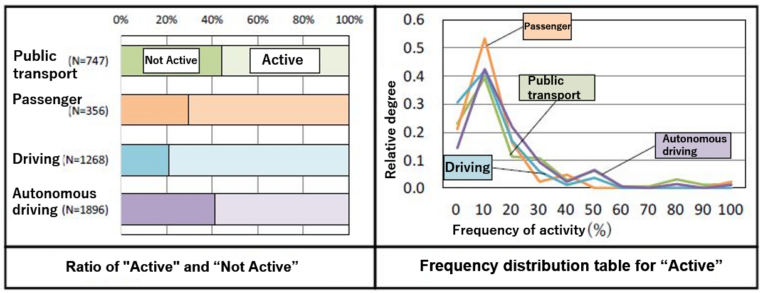
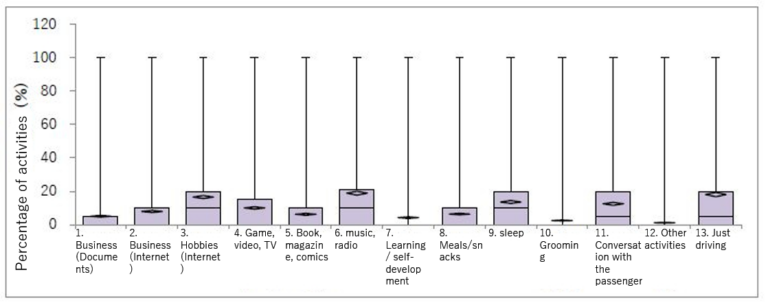
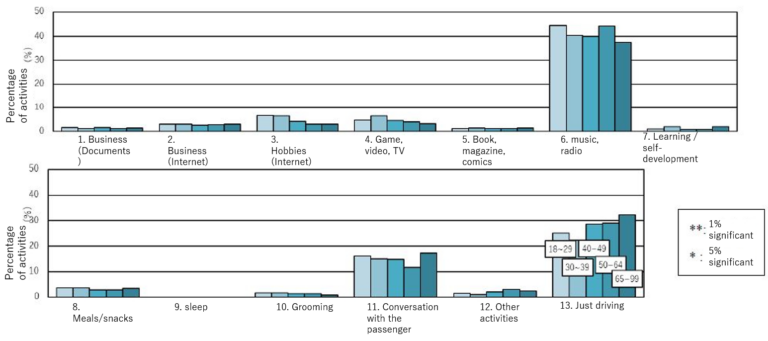
- The trend is for the percentage of people that are active as a result of autonomous driving to increase somewhat higher than that for Public Transport, and in particular for the activities that are easier to do in a highly private environment, namely “Meals, snacks between meals” and “Conversations with the other passengers”, where the increases were significant (Fig. 3, Fig. 4)
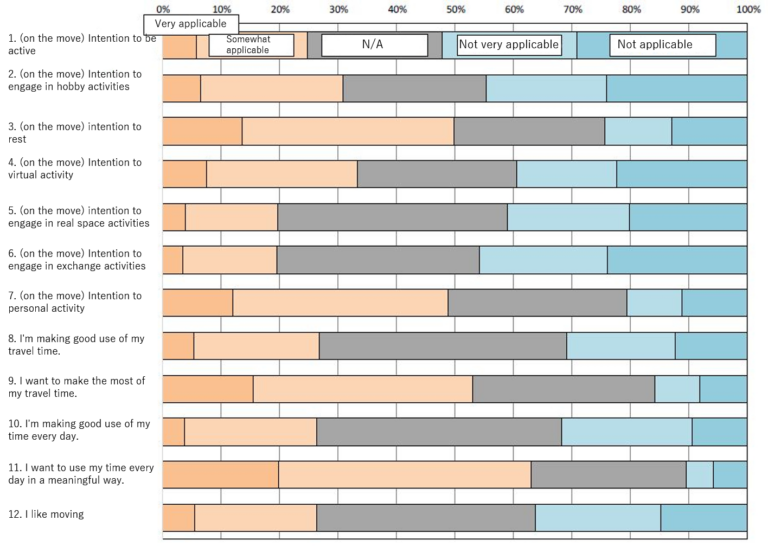
- The highest was a desire for rest activities
- The desire for virtual activities and individual activities was highest
- More than half of the responses were “Neither”, “Not very applicable”, and “Not applicable”. Basically most were not interested in activities while traveling
- No major difference was seen between “I want to use/I use traveling time in a productive way” and “Every day I want to use/I use time in a productive way”. However, within these two, the reply “I use . . in a productive way” accounts for less than 30%, and the reply “I want to use . . in a productive way” accounts for 50% to 60%. Therefore there is a difference, with many people considering that they want to use time in a productive way but cannot actually do so.
Factors Affecting Attitudes Regarding Activities after Automation of Driving
- Using one-way analysis of variance, the differences between current and future percentages of activities within vehicles were investigated according to attributes of individuals
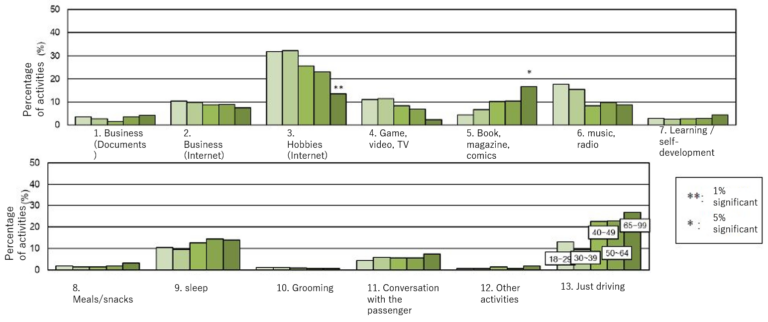
– Focusing on the differences according to age group, in Public Transport the proportion of “Hobbies (Internet)” became lower the higher the age, but the proportion of “books, magazines, manga” was higher
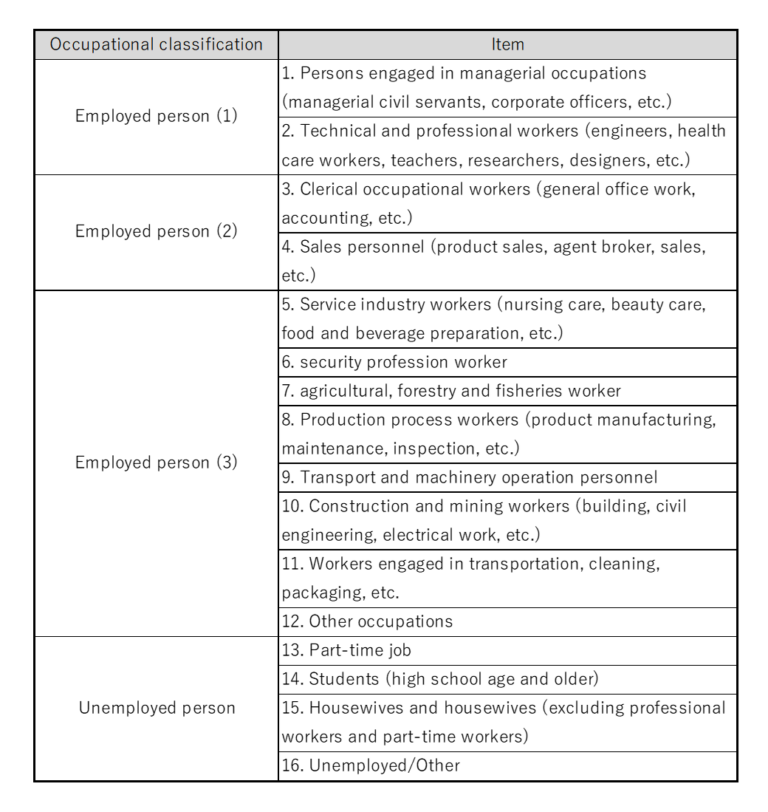
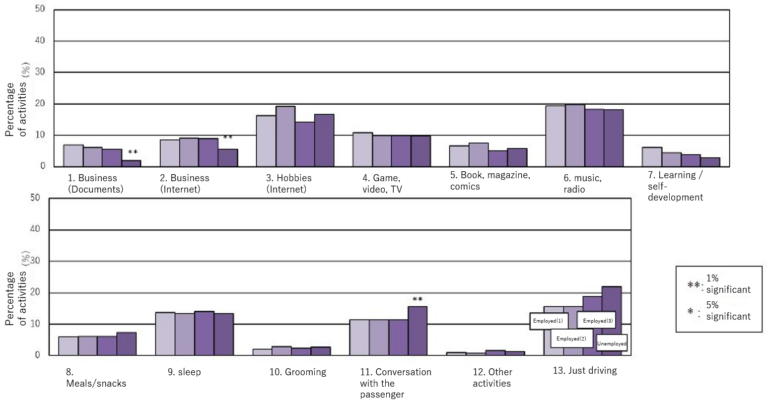
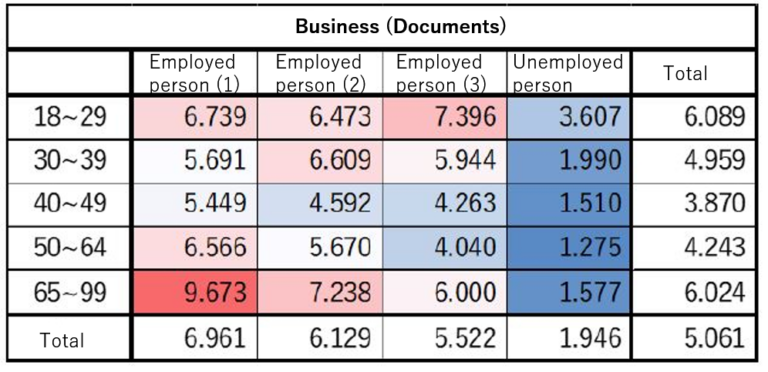
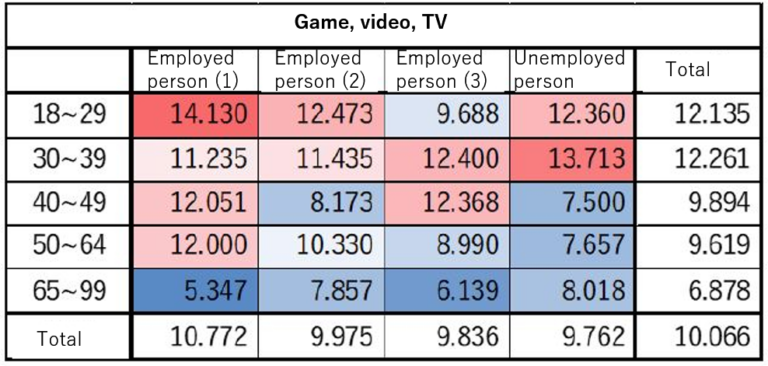
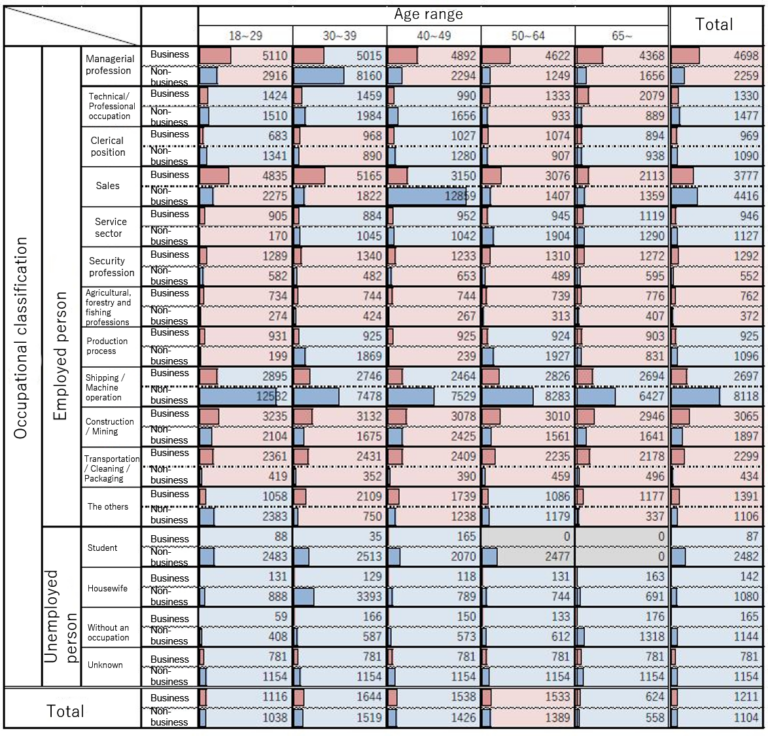
– Focusing on the differences according to type of work (Table 3), among those not employed the proportion of “conversation with other passengers” was high for both “Driving” and “Autonomous Driving”, and the proportions were low for “Work (documents)” and “Work (Internet)”
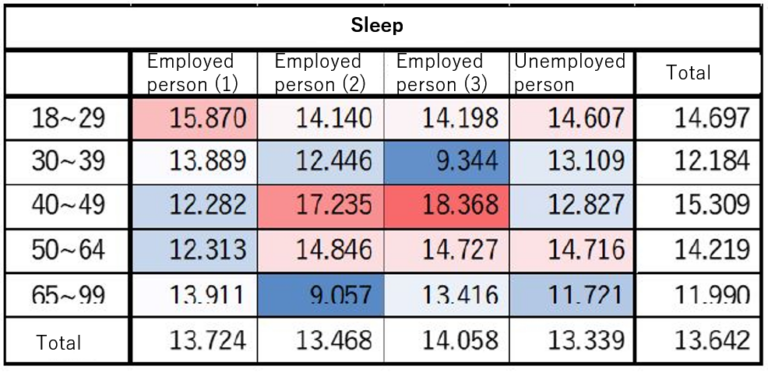
– Also, in the case of “Driving”, the proportions for “Music, radio” were low in the order employed persons ①, ②, ③, and unemployed persons. The proportion of time “Not doing anything” was lower among employed persons ① than among any other group. Regarding “Autonomous Driving”, the trends were similar among employed persons ① and ②, and in comparison with the other two groups the activity percentages were higher for “Work (documents)”, “Work (Internet)”, “Hobbies (Internet)”, “Games, video, television”, “Books, magazines, manga”, “Music, radio”, “Learning, self-development”, and the activity percentages were lower for “Meals, snacks between meals”, and “Not doing anything”
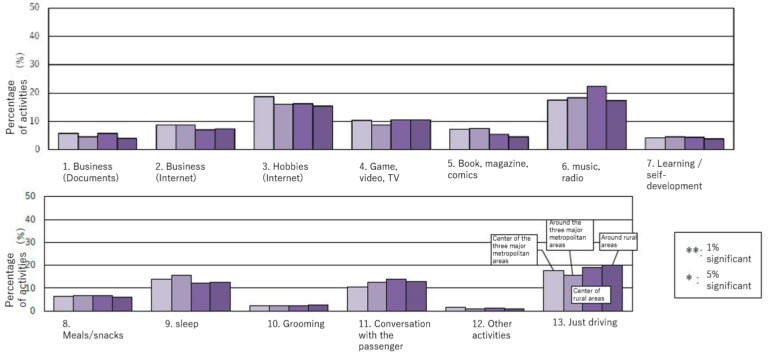
– Focusing on the differences according to city type, in the case of “Autonomous Driving”, the percentages of the activities “Work (documents)”, “Work (Internet)”, and “Sleep”, etc. were higher for residents of the three major urban areas, and in the rural areas the proportion of time for “Music, radio” and “Not doing anything” was higher
- Analyzing with the cross term of age group and work category, the following characteristics were found in “Autonomous Driving”
– The proportion of “Work activities (documents)” was particularly high among the elderly in employed persons ①
– The proportion of “Games, video, television” was higher among the younger age groups for all work categories, but compared with the unemployed the activity proportion was higher among the employed persons even for the higher age groups
– The activity proportion for “Sleeping” was high among the younger age groups of employed persons ① and the middle age groups of employed persons ② and ③
– Overall the percentage for “Not doing anything” was higher for the unemployed and for the higher age groups
- Using multiple regression analysis, the relationships between individual attributes and internal attributes and the percentages of activities within the vehicle after automation of driving were investigated
– For all activities, the work category has a comparatively large effect on the activity percentages
– In the case of “Work” and “Learning or self-development”, the positive attitude towards the activity had a positive effect, and in particular the coefficient was large in the case of “Learning or self-development”. On the other hand in the case of “Games, video, television”, etc., the positive attitude towards the activity had a significantly negative effect, and it is considered that these activities were performed by individuals that were not positive regarding activities within vehicles.
– Individuals that like traveling had a significant higher percentage of Not doing anything. This is a group that enjoys the traveling itself, so it is considered that they did not need to do activities during traveling.
– The potential for activities as a merit of autonomous driving was strongly and significantly positive for almost all activities, but in particular the effect was large in the case of “Sleeping”. This indicates that there are individuals whose desire for autonomous driving is based on the assumption that it is possible to sleep while traveling.
– The lifestyle “Many friends and acquaintances” was significantly positively correlated with “Work”, and was significantly negatively correlated with “Not doing anything”. Among the personality characteristics, the same trend was seen among those that were “Lively and outgoing”. From this it is considered that there is a possibility that the more a person is a socializer and outgoing the more actively they will undertake work activities within a vehicle.
– Regarding the differences between male and female, the percentage for “Work (documents)” was significantly higher in males, and the percentages for “Meals, snacks between meals”, “Improving one’s appearance”, and “Conversation with other passengers” were significantly higher in females
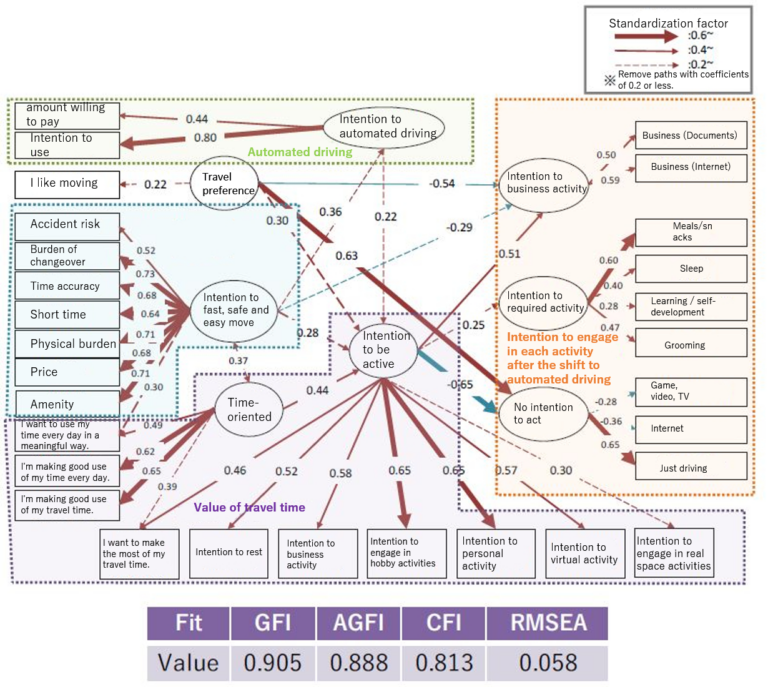
- Using covariance structure analysis, the structure of the relationship between activity percentages within a vehicle and the individual internal characteristics was determined
– Regarding attitudes towards activities after automation of driving, groups of activities such as work, essential activities, non-activities, etc., appeared as latent variables
– Focusing on enjoyment of traveling as a latent variable, it was found that this had the large positive effect on the attitudes towards no activity, and individuals that enjoyed travel itself had a low awareness of effectively using traveling time for activities
– There is a correlation relationship between the latent variable of emphasis on time and the latent variable of a wish for fast, safe, and convenient transport, and these two have a positive effect on the attitudes towards activities
Quantification of the Effect of Automation of Driving Focusing on the Value of Traveling Time
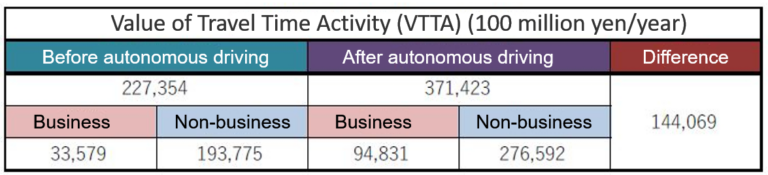
- The concept of Value of Travel Time Activity (VTTA), which is the total of the subjective value of the activities performed per unit time while traveling, is introduced to demonstrate the effect of automation of driving
- The following operations were performed in order to extend the results of the questionnaire data to the whole country
① Detailed investigation of the factors that affect the subjective value of travel time
② Preparation of segments for expansion using the All Japan PT Survey
③ Determining representative values for each segment
④ Addition of VTTA to the individual data of the All Japan PT Survey corresponding to each segment
⑤ Expansion of the individual data for VTTA using the magnification coefficients calculated in the All Japan PT Survey and the magnification coefficients for municipalities throughout Japan calculated in this survey
- The magnification results were as follows
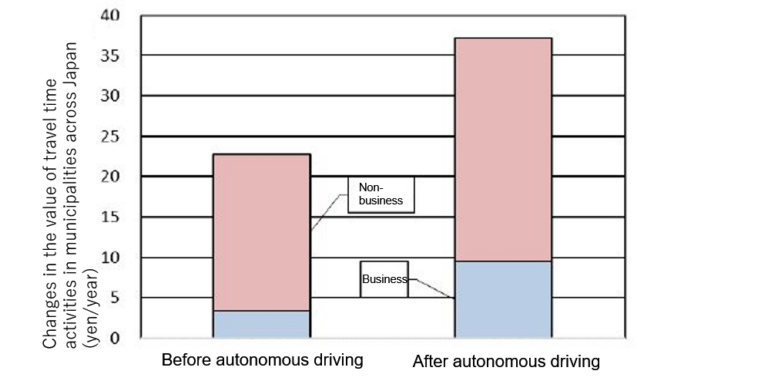
– The VTTA is increased by about ¥14.4 trillion per year as a result of automation of driving
– Focusing on the contents of the individual activities, the VTTA associated with nonwork activities exceeded the VTTA associated with work activities both before and after automation of driving. On the other hand the rate of increase was greater for the VTTA associated with work activities
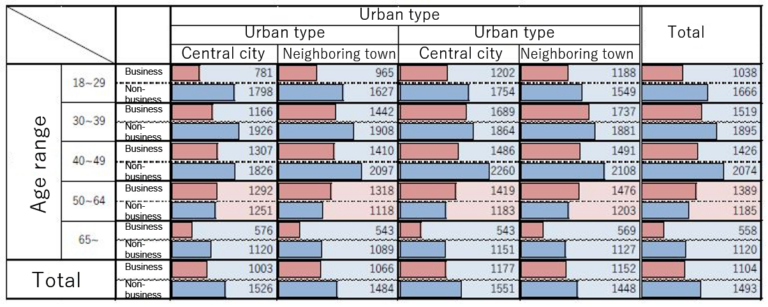
– Focusing on the amount of the increase in VTTA for each segment according to attribute, not much difference was found according to city type, but the trends were different for age group and work
Results
- The activities within vehicles after automation of driving are similar to those during use of public transport, but the percentages of work activities and leisure activities are increased, suggesting that the variation in activities during traveling will increase due to automation of driving
- It has been found that besides individual characteristics, the sense of value of traveling time and attitude towards automation of driving, lifestyle, etc., affect the attitude towards activities in a vehicle after automation of driving
- A model that structurally explains the relationship between the attitude towards activities within vehicles after automation of driving and individual internal attributes has been proposed
- The total of the increment of value of travel time activity in the municipalities throughout Japan exceeds the scale of the value of lost time due to traffic congestion at present
- Many individuals produce value by nonwork activities, and it has been found that their details and trends vary depending on their attributes
References
Prime Minister’s Office of Japan HP: “Public-Private ITS Initiative and Roadmap 2019”, Strategic Headquarters for the Promotion of an Advanced Information and Telecommunication Network Society – and Strategic Conference for the Advancement of Public and Private Sector Data Utilization https://www.kantei.go.jp/jp/singi/it2/kettei/pdf/20190607/siryou9.pdf (Last accessed January 2020)
“Research Report on Time Value of Road Transport”, Road Transport Time Value Research Group, Research Representative Hironori Kato, March 2012
Joshua Auld, Abolfazl (Kouros) Mohammadian, Peter C. Nelson “Empirical Analysis of the Activity-Planning Process”, Transportation Research Record January 1, 2011 Volume: 2231 issue: 1, page(s): 76-84
Hideto Katsuki, Masayuki Kawamoto, Morimitsu Kurino, Mamoru Taniguchi, “Automated Driving Vehicle Effects on Life Activities – Emphasis on Changes of Trip Frequency and Destination -“, Journal of Traffic Engineering, Vol. 3, No. 2, 2017, p A_1-A_10, Japan Society of Traffic Engineers
Steck, F., Kolarova, V., Bahamonde-Birke, F., Trommer, S. and Lenz, B. “How Autonomous Driving May Affect the Value of Travel Time Savings for Commuting”, Transportation Research Record: Journal of the Transportation Research Board, Vol. 2672, 2018, pp. 11–20.
Gonçalo Homem de Almeida Correia, Erwin Looff, Sander van Cranenburgh, Maaike Snelder, Bart van Arema “On the impact of vehicle automation on the value of travel time while performing work and leisure activities in a car: Theoretical insights and results from a stated preference survey” Transportation Research Part A: Policy and Practice Vol. 119, 1.2019, pp. 359-382
Ryusei KAKUJO, Makoto CHIKARAISHI, Akimasa FUJIWARA, “MULTI-TASKING BEHAVIOR IN AUTONOMOUS VEHICLE AND ITS IMPACTS ON RESIDENTIAL LOCATION CHOICE BEHAVIOR”, Proceedings of the 57th Civil Engineering Planning Research Group, 16-15