

abstract
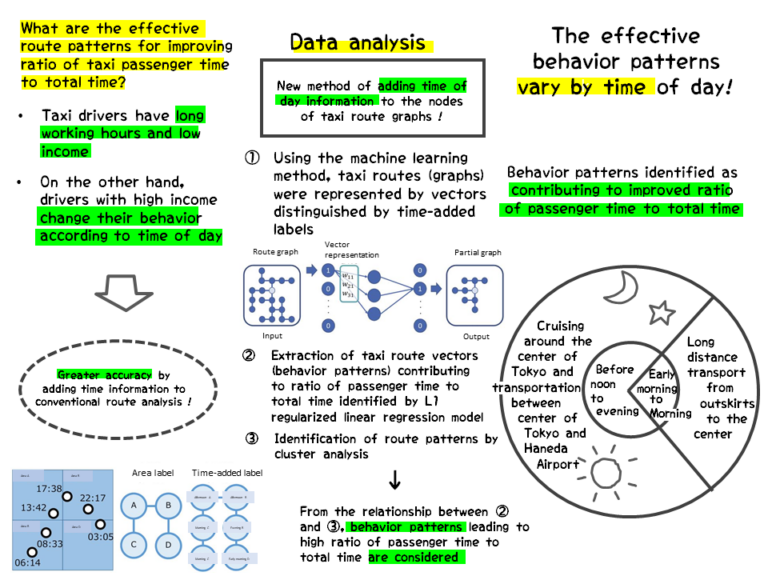
Background and Issues
The monthly working hours of taxi drivers is about 11% longer than the average for all industries, but their annual income is about 36% lower, so their pay and conditions are issues for review, and improvement in their operating efficiency is also required

- It is considered that detection of behavior patterns that contribute to increasing the ratio of passenger distance to total distance using taxi GPS is useful
- Research into analysis of taxi routes includes quantification of taxi demand heat maps by neural networks (Yao et al., 2018), analysis of routes using principal component scores expressing taxi routes by sparse matrices with the number of times passing through a zone as elements (Ma et al., 2019), vectorization of taxi routes using a feature embedding method such as a sparse autoencoder (Huang et al., 2019), etc.
- On the other hand, it has been reported that drivers with high income vary their behavior depending on the time of day, so it is considered necessary to quantitatively analyze taxi routes while taking the time of day into consideration
↓
In this research, vector representation of time-added graphs is proposed. Here, time of day information is added to each vertex (meaning that positional information of a taxi, assigned to quarter-area meshes with one side of about 250 m) of the graph expressing a taxi route.
Using this time-added vector information, a regression analysis was performed, with the ratio of passenger time to total time as the objective variable, to investigate which route vectors contributed to improving the ratio of passenger time to total time. In addition, cluster analysis of taxi routes was performed to identify effective taxi route patterns.
*Ratio of passenger time to total time = time driven while transporting passengers in one shift / total time driven in one shift
where one shift is a continuous time period for each driver, with a recording interval of less than three hours.
Analysis
Analysis Data
| Data name | Taxi probe (GPS tracking) data |
|---|---|
| Data supplier | 2019 Data Analysis Competition held by the Joint Association Study group of Management Science (JASMAC) |
| Data recording period | April 1, 2016 to March 31, 2018 |
| Data recorded | Company ID, driver ID, date and time at intervals of several 10s of seconds, vehicle status (transporting a passenger, empty, returning, etc.), latitude, longitude, etc. |
| Total number of routes analyzed | 13,240 |
*The raw data included the records of 7 taxi companies, and in this research companies that stopped recording during the recording period or whose recording interval was long were excluded, so 3 companies (89 drivers) were included in the analysis
*If the continuous working hours were four hours or fewer, or 24 hours or more, it was assumed that the values were outliers and they were excluded from the data. Also, if the average interval of the recording time was 100 seconds or more it was assumed that the data was inaccurate and it was excluded
- In order to obtain the regular pattern of behavior of the driver, the taxi routes when empty were expressed as a graph for boarding the vehicle 100 times continuously, with quarter-area meshes as vertices (nodes), and edges drawn when the taxi moves between meshes
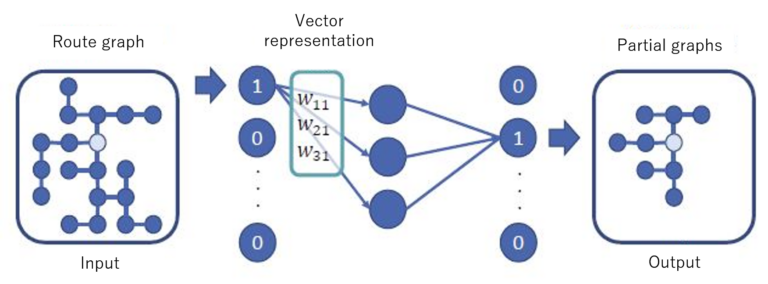
- The method of quantifying the graph was to use the Python library graph2vec (Narayanan et al., 2017) with modifications. With a two-layer (single intermediate layer, having 64 units) neural network, with the original route graph as input and partial graphs (a collection of graphs with random depth, having all the nodes as roots) as output, characteristic vectors were obtained (Fig. 1).
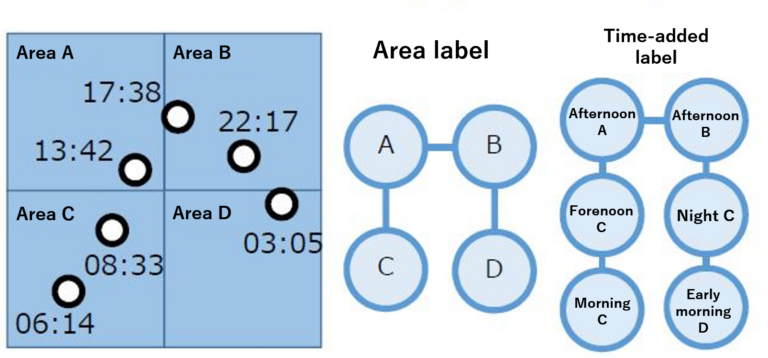
- The labels used for identifying each node were “order label” using the simple order (number of edges connected to the node), “area label” using the area mesh ID for the purpose of reflecting the positional information, and “time-added label” that combined the four time periods, morning (6-12:00 hours), afternoon (12-18:00 hours), evening (18-24:00 hours), and night (24-6:00 hours), with the area meshes, to investigate the efficacy of changing the behavior patterns by time period (Fig. 2)
Analysis 1: Ratio of passenger time to total time regression analysis
- In order to investigate which route vectors were associated with high ratios of passenger time to total time, analysis using an L1 regularized linear regression model (Lasso) was performed, with the average ratio of passenger time to total time for four consecutive working days for each driver as objective variable (transformed to logit), taxi route vector as explanatory variable, and information on the working day such as total working hours, number of shifts per month, number of shifts on each day of the week, and number of shifts in each form
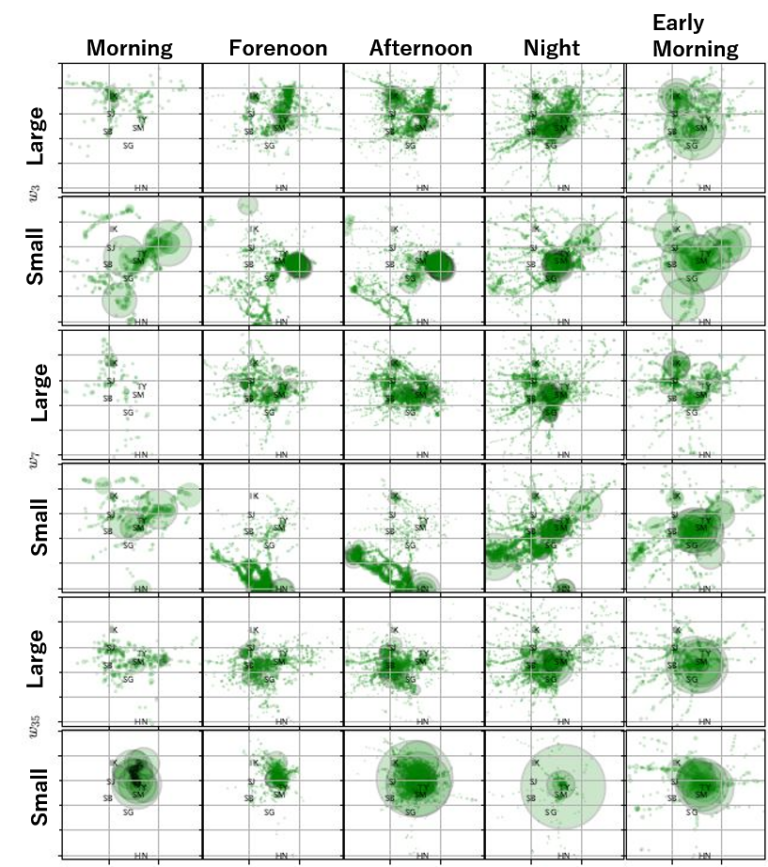
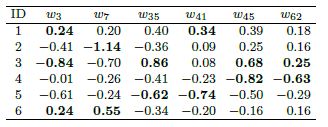
→ The model using the time-added label had the highest prediction accuracy for the taxi route vector - Table 1 shows the partial regression coefficients estimated by the least-squares method (without regularization term) using only the six explanatory variables (cab route vector) selected by Lasso with time-additive labels. The size of the circle indicates the number of times it was recorded.
→ For example, the route with a large value of the explanatory variable w3 (the first line of Figure 3) can be said to be a route where the taxi is running around the north side of Tokyo Station in the morning and afternoon, looking for passengers while driving around the city. In this way, we can conclude that a high number of actual cabs are waiting for passengers at cab stands.
⇒ In this way, the factors of cab routes that are associated with a high actual vehicle rate were found.

Analysis 2: Cluster analysis of taxi routes
- In order to identify the optimum taxi route patterns, 64-dimensional taxi route vectors generated using the time-added labels were classified by cluster analysis using the Ward method (calculated in squared Euclidean distance)
→ Six types of clusters (route patterns) were identified as a result of classification (Fig. 4)
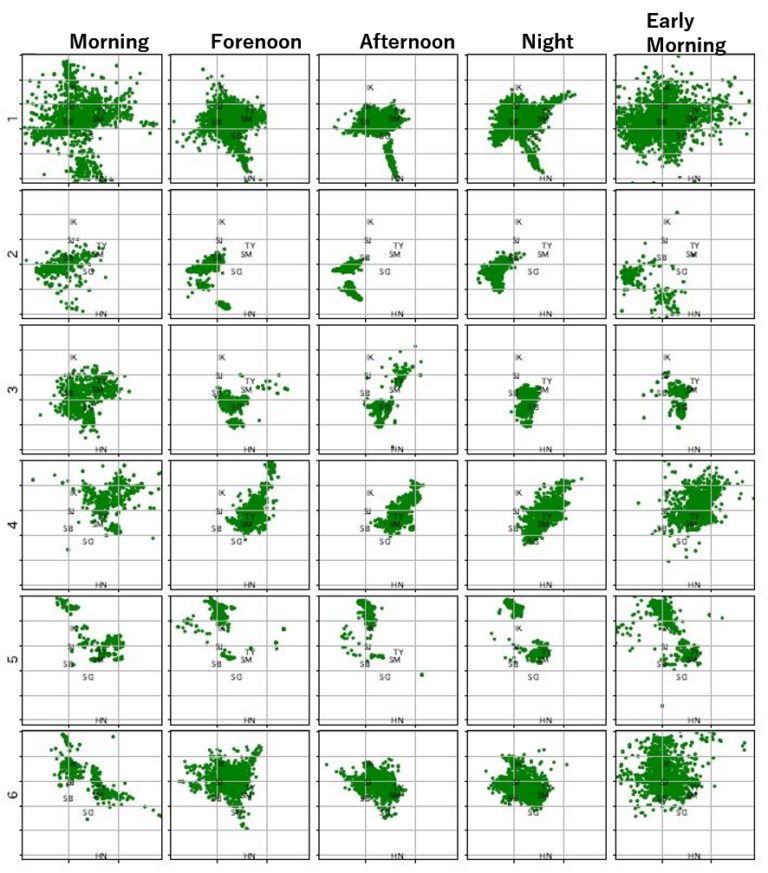
- The relationships found between the 6 vectors selected in Analysis 1 and each cluster are shown in Table 2, and the interpretation of each cluster is shown in Table 3
→ For example, in Cluster 1, which had the highest average actual vehicle rate, the central coordinates of the route are widely distributed in the morning, but they are clustered in central Tokyo by noon and then spread out again by early morning. Since the values of the explanatory variables w3 and w41 are the largest, cabs are seemed to cruise around their turf. Besides, the trend in which the central coordinates are distributed from Haneda Airport to the center of Tokyo between the morning and noon suggests that they are engaged in long-distance transportation in this region
⇒ In this way the behavior patterns by time period associated with a high ratio of passenger time to total time are determined

Results
- Based on the results of the analysis of the partial regression coefficients and the results of the analysis of clusters 1 and 6, which have relatively high actual vehicle rates, the following behaviors are considered to contribute to improving the actual vehicle rate
| Early morning to Morning | Long distance transport from outskirts to the center |
| Before noon to evening | Cruising around the center of Tokyo and transportation between center of Tokyo and Haneda Airport |
References
Q. Ma, H. Yang, H. Zhang, K. Xie and Z. Wang, “Modeling and analysis of daily driving patterns of taxis in reshuffled ride-hailing service market,” Journal of Transportation Engineering Part A: Systems, 145, 2019.
H. Yao, F. Wu, J. Ke, X. Tang, Y. Jia, S. Lu, P. Gong, J. Ye and Z. Li, “Deep multi-view spatial-temporal
network for taxi demand prediction,” arXiv:1802.08714, 2018.
Z. Huang, G. Shan, J. Cheng and J. Sun, “Trec: An efficient recommendation system for hunting passengers with deep neural networks,” Neural Computing and Applications, 31, pp. 209–222, 2019.
A. Narayanan, M. Chandramohan, R. Venkatesan, L. Chen, Y. Liu and S. Jaiswal, “Graph2vec:Learning
distributed representations of graph,” arXiv:1707.05005, 2017.